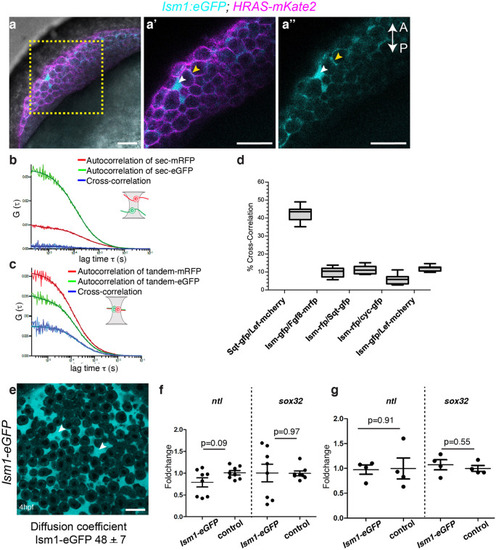
Ism1 interaction with Fgf8 and Nodal molecules in vivo a Ism1-eGFP and membrane localized mKate2 (HRAS-mKate2) was co-injected at 1-cell stage embryo, and images from live embryos were obtained at 50% epiboly (5.3 hpf). Ism1-eGFP was predominantly observed in the extra cellular space (white arrowhead) and close to the plasma membrane (yellow arrowhead). a′ and a″ Magnified images of the marked region in a. b, c By cross-correlating fluorescence fluctuations (FCCS) in two spectral channels, bimolecular binding can be inferred because only co-diffusing binding partners lead to a considerable cross-correlation. Coinjection of secreted mRFP (Sec-mRFP) and secreted eGFP (Sec-eGFP) showed no cross- correlation, while a tandem construct with mRFP and eGFP showed cross- correlation. d. sqt and lefty have about 45% cross correlation, while that between Ism1 and fgf8a, sqt, cyc, or lefty was about 15%, which is in the range of random interactions (background). e The diffusion coefficient of Ism1-eGFP was measured using FCS in the extracellular space (indicated with arrowhead) of sphere stage embryos (4 hpf) injected with Ism1-eGFP mRNA at the 1-ll stage. Ism1-eGFP diffusion coefficient was 48 ± 7 μm2 s−1 f and g. qRT PCR analysis of Ism1-eGFP or mCerulean (control) injected embryos (mRNA or DNA) showed no significant difference in the gene expression levels of the mesoderm marker ntl or the endoderm marker sox32. Embryos were harvested at 50% epiboly (5.3 hpf), and each sample represents a pool of 10 embryos. P values from unpaired t tests are indicated within the graph. Numbers of embryos analyzed for FCS and FCCS are presented in Table 3. The total number of embryos (n) analyzed in panel a (n = 8). Scale bar 20 μm
|
