
Fig. 1
- ID
- ZDB-FIG-210318-8
- Publication
- Kawasaki et al., 2021 - Coevolution of enamel, ganoin, enameloid, and their matrix SCPP genes in osteichthyans
- Other Figures
- All Figure Page
- Back to All Figure Page
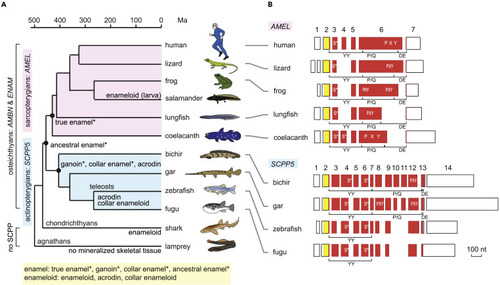
(A) Phylogenetic distribution of enamel, enameloid, and their matrix genes. Hypermineralized tissues classified as enamel are denoted by an asterisk. Divergence times are based on previous studies: most sarcopterygian taxa (Hedges and Kumar, 2009), actinopterygian taxa (Near et al., 2012), lungfish-tetrapods and chondrichthyans-osteichthyans (Giles et al., 2017), and agnathans-gnathostomes (Kuraku and Kuratani, 2006). (B) Exon-intron structure of AMEL and SCPP5. Separate boxes represent exons. Open areas in exons show 5′ and 3′ untranslated regions. The areas encoding the signal peptide and mature protein are shown in yellow and vermilion, respectively. Exon numbers are indicated for human AMEL (AMELX) and bichir scpp5. Locations encoding phospho-Ser residues (S∗) (Kawasaki and Amemiya, 2014) and Pro-Xaa-Yaa (Xaa and Yaa represent any amino acids; PXY) repeats are illustrated within exon boxes. Regions encoding the three modules, the N-terminal aromatic residue-rich region (YY), the Pro/Gln-rich core region containing uninterrupted PXY repeats (P/Q), and the C-terminal hydrophilic region (DE), are indicated below exon boxes. Scale bar, 100 nucleotides (nt). See Figure S1A for details. |