
FIGURE
Figure 2
- ID
- ZDB-FIG-210224-9
- Publication
- Holmgren et al., 2021 - Using the Zebrafish Lateral Line to Understand the Roles of Mitochondria in Sensorineural Hearing Loss
- Other Figures
- All Figure Page
- Back to All Figure Page
Figure 2
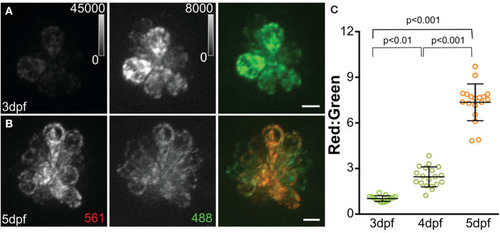
MitoTimer fluorescence in hair cells. |
Expression Data
Expression Detail
Antibody Labeling
Phenotype Data
Phenotype Detail
Acknowledgments
This image is the copyrighted work of the attributed author or publisher, and
ZFIN has permission only to display this image to its users.
Additional permissions should be obtained from the applicable author or publisher of the image.
Full text @ Front Cell Dev Biol