
Fig. 5
- ID
- ZDB-FIG-210209-5
- Publication
- Triplett et al., 2020 - Model-based decoupling of evoked and spontaneous neural activity in calcium imaging data
- Other Figures
- All Figure Page
- Back to All Figure Page
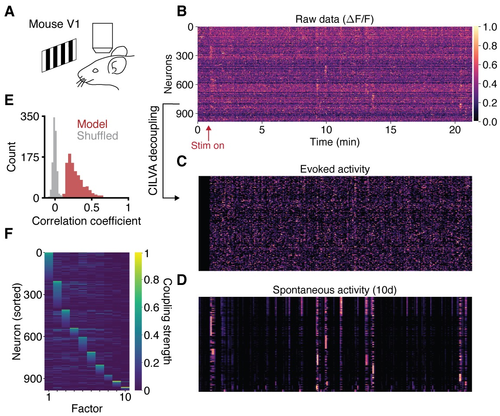
Fig 5. Single-trial decoupling of EA and SA in visual cortex. (A) Calcium imaging of mouse V1 during presentation of drifting gratings. (B) Raw data consists of 21 minutes of neural activity from 986 neurons. The fluorescence trace of each neuron is normalised to take values between 0 (dark) and 1 (light). Neurons sorted as in panel F. (C) Decoupled evoked component of neural activity. (D) Decoupled spontaneous component of neural activity, given a latent dimensionality of 10. (E) Distribution of correlation coefficients between data and model fits. Shuffled data obtained by cyclically permuting each trace by a random offset while preserving its temporal structure. (F) Learned factor coupling matrix showing that the inferred factors target largely non-overlapping sets of neurons. |