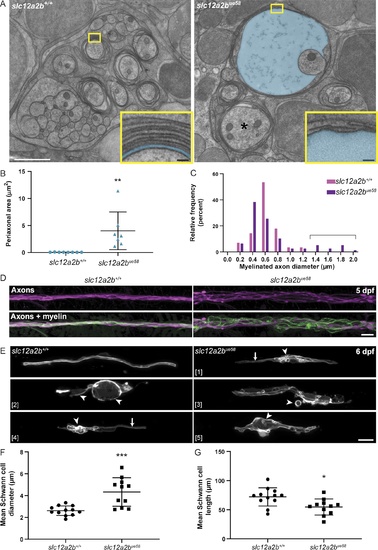
Disruption to NKCC1b leads to swelling of the periaxonal space, dysmyelination, and axonal disorganization. (A) Electron micrographs of high-pressure–frozen pLLn in control (left) and slc12a2bue58 mutant (right) at 5 dpf. slc12a2bue58 mutants show significant enlargement of the periaxonal space, highlighted in blue and enlarged axons (asterisk). Insets show a higher magnification to highlight the periaxonal space in controls and slc12a2bue58 mutants. White scale bar, 1 µm. Black scale bars, 50 nm. (B) Quantification of periaxonal area in control and slc12a2bue58 mutants (control 0.05 ± 0.02 µm2 vs. slc12a2bue58 4 ± 3.5 µm2, P = 0.0065). Error bars represent mean ± SD. A two-tailed Student’s t test was used to assess statistical significance. Each point represents an individual myelinated axon from three control and five slc12a2bue58 mutant animals. **, P < 0.01. (C) Quantification of the diameter of myelinated axons in control and slc12a2bue58 mutants. Bracket indicates axons in the mutant with greater than normal diameter. (D) Confocal images of live Tg(cntn1b:mCherry), Tg(mbp:EGFP-CAAX) double-transgenic control (left) and slc12a2bue58 mutant (right) animals at 5 dpf indicates axonal defasciculation and derangement of myelin. Scale bar, 10 µm. (E) Confocal images of individual mosaically labeled Schwann cells in control (top left panel) and slc12a2bue58 mutants (panels 1–5) highlighting the variable morphological manifestation of the mutant phenotype. Scale bar, 10 µm. Arrows point to regions of normal appearing myelin and arrowheads to dysmyelination. (F) Quantitation of mean Schwann cell diameter in maximum intensity projection images of single Schwann cells at 6 dpf (control 2.6 ± 0.4 µm vs. slc12a2bue58 4.3 ± 1.3 µm, P = 0.0003). Error bars represent mean ± SD. A two-tailed Student’s t test was used to assess statistical significance. Each point represents a single cell from 11 control and 10 slc12a2bue58 mutant animals. Scale bar, 10 µm. ***, P < 0.001. (G) Quantitation of mean Schwann cell length in maximum intensity projection images of single Schwann cells at 6 dpf (control 72.1 ± 15.7 µm vs. slc12a2bue58 54.7 ± 13.8 µm, P = 0.011). Error bars represent mean ± SD. A two-tailed Student’s t test was used to assess statistical significance. Each point represents a single cell from 11 control and 10 slc12a2bue58 mutant animals. *, P < 0.05.
|
