FIGURE

Figure 1

ID
ZDB-FIG-210204-57
Publication
Xie et al., 2021 - Modeling Inflammation in Zebrafish for the Development of Anti-inflammatory Drugs
Other Figures
All Figure Page
Back to All Figure Page
Figure 1

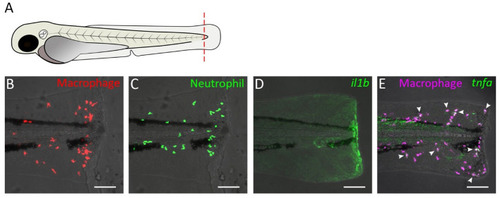
Tail transection in zebrafish larvae as a model for inflammation. (A) Schematic drawing of a zebrafish larva at 3 dpf. The dashed red line shows a site of transection (in some studies, the transection site may not include the a part of notochord). (B–E) Confocal microscopy images of tail from amputated larvae of the following transgenic lines: Tg(mpeg1:mcherry-F)(B), Tg(mpx:GFP)(C), Tg(il1b:GFP)(D), Tg(mpeg1:mCherry-F/tnfa:eGFP-F)(E). Images were taken at 4 h post-amputation using a Nikon Eclipse Ti-E microscope with a Plan Apo 20X/0.75 NA objective. Images show accumulation of macrophage (B) and neutrophils (C), activation of the il1b gene (D), and tnfa expression in macrophage (E) near the wound. In (E), arrow heads indicate macrophages in which tnfa was activated.

Expression Data

Expression Detail
Antibody Labeling
Phenotype Data

Phenotype Detail
Acknowledgments
This image is the copyrighted work of the attributed author or publisher, and ZFIN has permission only to display this image to its users. Additional permissions should be obtained from the applicable author or publisher of the image. Full text @ Front Cell Dev Biol