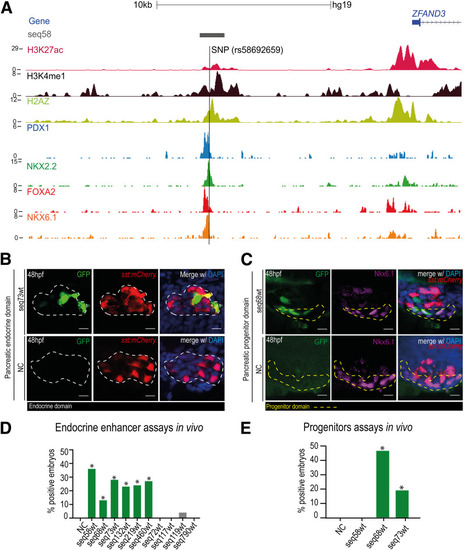
A: Genomic landscapes of the putative enhancer seq58. Tracks represent H3K27ac, H3K4me1, histone variant H2A.Z, and TF binding (PDX1, NKX2.2, FOXA2, and NKX6.1) from ChIP-seq data of human endocrine pancreatic samples. Human ZFAND3 is the nearest gene to the putative enhancer (blue). The location of the type 2 diabetes–associated SNP (rs58692659) is represented as a vertical black line. B: In vivo reporter assay for endocrine pancreatic enhancers. Top panels show a representative confocal image a sst:mCherry zebrafish embryo injected with the Z48 enhancer reporter vector containing the seq73wt sequence, showing GFP-positive cells within the endocrine pancreatic domain (dashed line), contrasting that absent in embryos injected with NC (bottom). Scale bars = 10 μm. C: In vivo reporter assay for pancreatic progenitor enhancers. Confocal analysis of seq68 reporter assay shows colocalization of GFP-positive cells with Nkx6.1 progenitor marker, contrasting with NC for the pancreatic progenitor domain (dashed line) that did not show GFP-positive cells. All vectors were injected in the sst:mCherry reporter line and embryos analyzed at 48 hpf and stained with DAPI. Scale bars = 10 μm. D: Graph representing the percentage of embryos with GFP expression in endocrine pancreatic domain at 48 hpf for each sequence analyzed: seq58wt (36%, n = 56), seq68wt (13%, n = 47), seq73wt (28%, n = 47), seq132wt (23%, n = 34), seq219wt (24%, n = 38), seq460wt (27%, n = 36), seq72wt (0%, n = 27), seq117wt (0%, n = 21), seq119wt (4%, n = 27), seq790wt (0%, n = 20), and NC (0%, n = 43). E: Graph representing the number of embryos with GFP expression in pancreatic progenitor domain, defined by Nkx6.1 staining at 48 hpf, for each sequence analyzed: seq58wt (0%, n = 12), seq68wt (46%, n = 13), seq73wt (25%, n = 12), and NC (0%, n = 43). *P < 0.05, by χ2 test.
|
