FIGURE

Fig. 10

ID
ZDB-FIG-201012-17
Publication
Fernando et al., 2020 - Integration of anatomy ontology data with protein-protein interaction networks improves the candidate gene prediction accuracy for anatomical entities
Other Figures
All Figure Page
Back to All Figure Page
Fig. 10

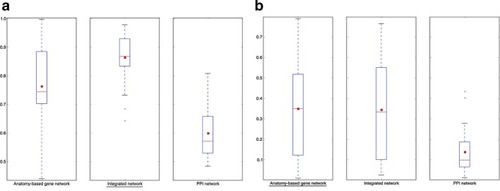
The network performance comparisons for zebrafish networks when evaluated by randomly removed 30 anatomical entities. The boxplot comparisons of the AUC distributions for a ROC and b precision–recall curves for the filtered integrated network, PPI network, and anatomy-based gene network for the Wang method for zebrafish. The integrated network and the anatomy-based gene network were generated using the zebrafish anatomy profiles after randomly removing 30 anatomical entities, which had at least 10 gene annotations. The same 30 entities were used for the evaluation. In the boxplots, the red line and the square represent the median and mean, respectively, and the name of the best performing network is underlined

Expression Data

Expression Detail
Antibody Labeling
Phenotype Data

Phenotype Detail
Acknowledgments
This image is the copyrighted work of the attributed author or publisher, and ZFIN has permission only to display this image to its users. Additional permissions should be obtained from the applicable author or publisher of the image. Full text @ BMC Bioinformatics