Clinical presentation of the <styled-content toggle='no' style='fixed-case'>FND</styled-content> pedigree and generation of control, father, and subject‐derived <styled-content toggle='no' style='fixed-case'>iPSC</styled-content>
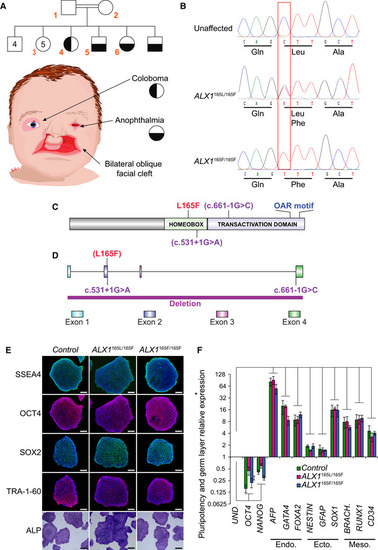
The pedigree family tree includes two unaffected parents, four unaffected male siblings, five unaffected female siblings, and two each female and male affected sibling. Subjects 1–6, indicated in red, were enrolled in the study. Subjects 4–6 show complex FND with ocular involvement. The eldest affected sibling (subject 4) presented with right coloboma, left microphthalmia, and bilateral Tessier 4 oblique facial clefts. Subject 5 presented with bilateral anophthalmia with fused eyelids and shallow orbits, with bilateral oblique facial clefts. Subject 6 presented with bilateral anophthalmia with open shallow orbits, absent upper and lower eyelids, exposed orbital mucosa, bilateral oblique facial clefts, and malformed nasal ala with nodular skin tags. iPSCs were generated using blood samples collected from subjects 1, 5, and 6.
Whole‐exome sequencing was carried out and analysis revealed a missense p.L165F variant (c.493 C>T) in the ALX1 homeodomain, heterozygous in the parents (ALX1165L/165F), wild type in the unaffected sibling (ALX1165L/165L), and homozygous in both affected subjects (ALX1165F/165F).
Schematic of the ALX1 protein structure showing the position of the L165F substitution described here (red) and the locations of exon borders affected by two reported pathogenic variants (purple; Ullah et al, 2016; Uz et al, 2010).
Schematic of the ALX1 genomic sequence, showing the locations of the three reported pathogenic variants. The purple bar at the bottom represents a FND‐associated homozygous ALX1 deletion previously reported in the literature (Uz et al, 2010; Ullah et al, 2016).
Immunofluorescence staining for pluripotent markers SSEA4, OCT4, SOX2, and TRA‐1-60 and alkaline phosphatase staining of iPSC clones. One representative iPSC clone is shown for each genotype. Scale bar: 400 μm.
Expression of pluripotent (OCT4, NANOG), endoderm (Endo., AFP, GATA4, FOXA2), ectoderm (Ecto., NESTIN, GFAP, SOX1), and mesoderm (Meso., BRACH. (BRACHYURY), RUNX1, CD34) gene markers for ALX1165L/165L (green), ALX1165L/165F(red), and ALX1165F/165F (blue) iPSC relative to undifferentiated cells (UND). Data are represented as pooled mean ± SEM of three experiments on three clones from each genotype. Significance: P = 0.0167 for OCT4, P = 0.0005 for NANOG, P = 0.000004 for AFP, P = 0.0082 for GATA4, P = 0.0137 for FOXA2, P = 0.00002 for NESTIN, P = 0.0167 for GFAP, P = 0.0014 for SOX1, P = 0.0117 for BRACHYURY, P = 0.0008 for RUNX1 and P = 0.0068 for CD34 when comparing undifferentiated and differentiated ALX1165L/165L iPSC. P = 0.0013 for OCT4, P = 0.0011 for NANOG, P = 0.0000003 for AFP, P = 0.0003 for GATA4, P = 0.0063 for FOXA2, P = 0.0001 for NESTIN, P = 0.027 for GFAP, P = 0.000002 for SOX1, P = 0.000009 for BRACHYURY, P = 3e−9 for RUNX1 and P = 0.000006 for CD34 when comparing undifferentiated and differentiated ALX1165F/165L iPSC. P = 0.0201 for OCT4, P = 0.006 for NANOG, P = 1 × 10⁻¹² for AFP, P = 5 × 10‐13 for GATA4, P = 0.0031 for FOXA2, P = 0.0292 for NESTIN, P = 0.00001 for GFAP, P = 6 × 10‐7 for SOX1, P = 0.0204 for BRACHYURY, P = 0.0009 for RUNX1 and P = 0.000003 for CD34 when comparing undifferentiated and differentiated ALX1165F/165F iPSC. Data from each clone were pooled, and the mathematical mean was calculated. SEM was used to determine the standard error. To test statistical significance, an ANOVA test was performed. A P‐value < 0.05 was considered to be statistically significant.
Expression Data
Expression Detail
Antibody Labeling
Phenotype Data
Phenotype Detail
Acknowledgments
This image is the copyrighted work of the attributed author or publisher, and
ZFIN has permission only to display this image to its users.
Additional permissions should be obtained from the applicable author or publisher of the image.
Full text @ EMBO Mol. Med.
Your Input Welcome
Thank you for submitting comments. Your input has been emailed to ZFIN curators who may contact you if
additional information is required.
Oops. Something went wrong. Please try again later.