|
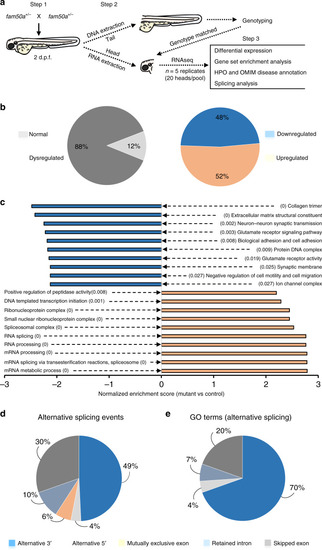
RNA-seq analysis revealed mRNA splicing defects in <italic>fam50a</italic> KO zebrafish.a Schematic describing the RNA-seq experiment from sample preparation to data analysis. Steps 1 and 2 describe sample collection and preparation, whereas step 3 indicates the RNA data analysis and interpretation. Each replicate pool (n = 5 per genotype) contained total RNA from 20 genotype-matched larval heads at 2 days post-fertilization (dpf). fam50a+/− (heterozygous mutant). b Pie charts representing differential expression analysis results for KO vs WT. Transcripts with FDR-corrected p < 0.05 were included (Wald test, FDR-corrected with the Benjamini–Hochberg method). c Gene set enrichment analysis was performed using normalized enrichment score for KO vs WT. The top ten significantly disrupted pathways (depleted or augmented) are plotted along the x axis. Downregulated gene sets, orange; upregulated gene sets, blue. p-values (FDR-corrected) are indicated in parentheses (Kolmogorov–Smirnov test). d Pie chart representing percentage of alternative splicing events (by category) that are enriched in fam50a KO. p < 0.05, likelihood-ratio test with FDR correction. e Pie chart representing the distribution of GO terms impacted by discrete alternative splicing events (by category) in fam50a KO. p < 0.05, Fisher’s exact test.
|