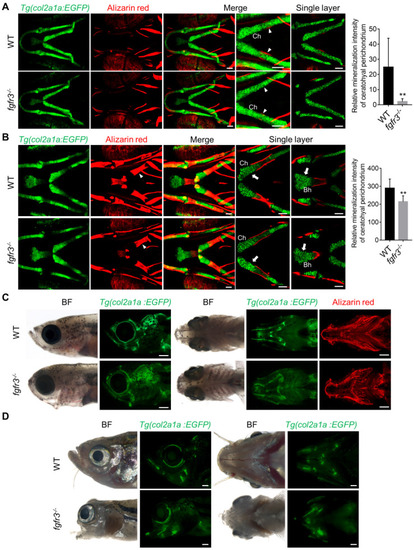
Fgfr3 regulates the patterning and shaping of pharyngeal arche. (A-B) Confocal imaging of WT and fgfr3 mutants in Tg(col2a1a:EGFP) background live stained with Alizarin red at 10 dpf (SL 5.0 mm) (A) and 20 dpf (SL 7.5 mm) (B). From left to right are 3D view of Tg(col2a1a:EGFP) image, Alizarin red staining image, merged 3D view image and merged single layer image. The right panel are the quantification of relative mineralization intensity of ceratohyal perichondrium for WT and fgfr3 mutants. White arrowheads indicate that perichondral ossification of ceratohyal cartilage was delayed in fgfr3 mutants. White arrows indicate disarrangement of chondrocytes of ceratohyal cartilage and basihyal cartilage in fgfr3 mutants in contrast to WT. n = 10, **p < 0.01. (C) Stereo fluorescence microscope imaging of WT and fgfr3 mutants at 30 dpf (SL 10.0 mm) in lateral view (left) and ventral view (right) after live stained with Alizarin red in Tg(col2a1a:EGFP). (D) Stereo fluorescence microscope imaging of WT and fgfr3 mutants at about 3 months (SL 26.0 mm) in lateral view (left) and ventral view (right) in Tg(col2a1a:EGFP). Ch: ceratohyal cartilage; Bh: basihyal cartilage. Scale bars: 50 µm in A and B, 400 µm in C and D.
|
