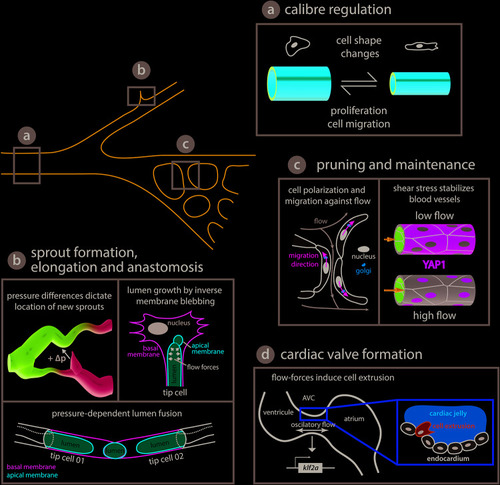
Endothelial cell behaviors triggered by flow-derived mechanical cues during vascular network growth and development. (a) Arteries adjust their caliber in response to hemodynamic forces. Arteries can either reduce their diameter via coordinated cell shape changes (Sugden et al., 2017) or increase the diameter by cell proliferation and migration toward enlarging vessels (Udan et al., 2013; Poduri et al., 2017). (b) Blood pressure has been shown to play a central role in network growth. The location and growth of newly forming sprouts is set by local differences in blood pressure (high and low pressure, magenta and cyan, respectively, Ghaffari et al., 2015). In addition, intraluminal pressure causes inverse blebbing of the apical membrane that drives lumen growth in new sprouts – drawn after Gebala et al. (2016). Similarly, during vessel anastomosis the apical membranes of two adjacent tip cells are pushed toward each other in a blood pressure-dependent fashion – illustration after Lenard et al. (2013). (c) Vascular networks can be remodeled in response to shear stress. Cell polarization and migration against the flow direction can lead to retraction of poorly irrigated vessels – sketched after Franco et al. (2016) – while vessels exposed to vigorous flow are kept by shear stress induced translocation of YAP to the nucleus – depiction after Nakajima et al. (2017). (d) Flow-derived mechanical cues can lead to cell extrusion and the formation of new structures such as the atrioventricular canal (AVC) valve or trigger cell fate transitions as seen during hematopoietic stem cell formation (see Figure 3). During AVC valve formation oscillatory blood flow triggers expression of the transcription factor klf2a, which is thought to promote invasion of the cardiac jelly by endocardial cells thus initiating the formation of the valve leaflets. Diagram after Heckel et al. (2015) and Steed et al. (2016).
|
