
FIGURE
Fig. s4
- ID
- ZDB-FIG-200625-19
- Publication
- Geirsdottir et al., 2019 - Cross-Species Single-Cell Analysis Reveals Divergence of the Primate Microglia Program
- Other Figures
- All Figure Page
- Back to All Figure Page
Fig. s4
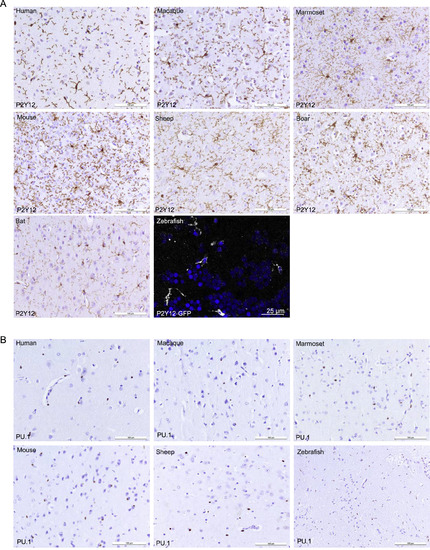
Conservation of P2Y12 and PU.1 across Microglia Evolution, Related to Figure 3 (A) Representative P2Y12 immunohistochemistry microscopical images from paraffin brain sections from human, macaque, marmoset, mouse, sheep, boar or bat as well as representative immunofluorescence image from brain section from zebrafish. Scale bar represents 100 μm or 25 μm (zebrafish). (B) Representative PU.1 immunohistochemistry microscopical images from paraffin brain sections from human, macaque, marmoset, mouse, sheep or zebrafish. Scale bars represents 100 μm. |
Expression Data
Expression Detail
Antibody Labeling
Phenotype Data
Phenotype Detail
Acknowledgments
This image is the copyrighted work of the attributed author or publisher, and
ZFIN has permission only to display this image to its users.
Additional permissions should be obtained from the applicable author or publisher of the image.
Reprinted from Cell, 179, Geirsdottir, L., David, E., Keren-Shaul, H., Weiner, A., Bohlen, S.C., Neuber, J., Balic, A., Giladi, A., Sheban, F., Dutertre, C.A., Pfeifle, C., Peri, F., Raffo-Romero, A., Vizioli, J., Matiasek, K., Scheiwe, C., Meckel, S., Mätz-Rensing, K., van der Meer, F., Thormodsson, F.R., Stadelmann, C., Zilkha, N., Kimchi, T., Ginhoux, F., Ulitsky, I., Erny, D., Amit, I., Prinz, M., Cross-Species Single-Cell Analysis Reveals Divergence of the Primate Microglia Program, 1609-1622.e16, Copyright (2019) with permission from Elsevier. Full text @ Cell