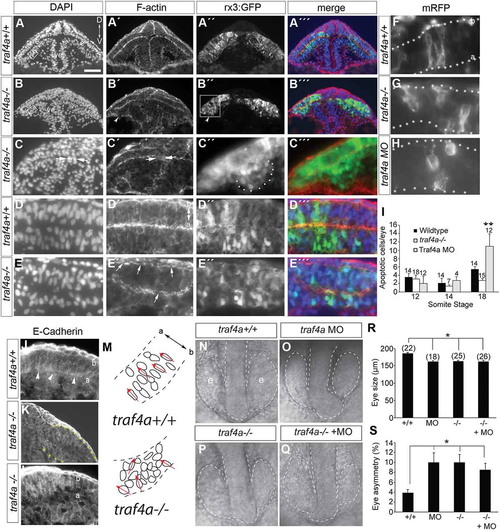
Eye epithelium disrupted in traf4a CRISPR mutant. A-E: Transverse sections through the eye vesicles (e) of wild-type (A,D) and traf4a-/- 12 ss Tg(rx3:GFP) (B,C,E) embryos revealing DAPI-stained nuclei (A-E) and rhodamine-phalloidin stained F-actin (A’-E’), with merge in A’’’-E’’’. In B’ arrowhead points to a bulge off the eye vesicle (shown at higher magnification in C’’), and in C,C’ arrows point to cell cluster in ventricle (ve). Scale bar in A is 100 µm for A-B, 75 µm for C,C’ and 25 µm for C’’,C’’’,D-E,J-L. Higher magnification view (D,E) reveals disruption of organization of DAPI nuclei (E) and non continuous F-actin (E’, arrows) in mutant. F-H: mRFP expressing progenitors in the eyes of wildtype (F), traf4a-/- (G) and traf4a morphant (H) 14 ss embryos. I: Graph of the mean number of activated Caspase-3 positive cells in the whole eye of embryos at the indicated somite stages. Error bars are standard error of the mean (s.e.m.) and numbers above the bars indicate the numbers of embryos assessed (data pooled from two independent experiments). **, p < 0.01 One Way ANOVA, Bonferroni correction. J-L: E-Cadherin labeling of 14 ss wildtype (J) and traf4a-/- (K) rx3:GFP embryo (high power in L). Arrowheads show accumulation of E-Cadherin label at the apical surface in wildtype. M: Schematic of DAPI-labeled nuclei in boxed areas in A and B, with the orientation of selected nuclei indicated by red arrows. N-Q: Dorsal brightfield images of traf4a+/+ (N), e1i1 MO+ traf4a+/+ (O), traf4a-/- (P), and e1i1 MO+ traf4a-/- (Q) embryos with the eye vesicle and brain outlined. R-S: Quantitation of size of smallest 12 ss eye (R) and the % difference between the sizes of the two eyes (S). Number of embryos analyzed is shown. Error bars are standard deviation. *p < 0.05, Kruskal Wallis One Way ANOVA, followed by Dunn’s method for multiple comparisons. a, apical; b, basal.
|
