
FIGURE
Fig. 2 S1
Fig. 2 S1
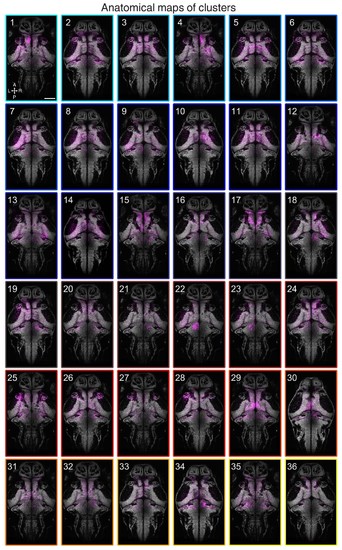
Anatomical maps of clusters.Images show dorsal views of intensity sum projections of all neuronal masks in each cluster (magenta) after registration to the elavl3:H2B-GCaMP6s reference brain. Projections (obtained through all focal planes,~100 µm total depth) are overlaid on a maximum-intensity projection image (grey) from the elavl3:H2B-GCaMP6s reference brain (five planes, 5 µm depth, from focal planes with the largest number of neurons in each cluster). Scale bar, 100 µm. A, anterior; L, left; P, posterior; R, right. |
Expression Data
Expression Detail
Antibody Labeling
Phenotype Data
Phenotype Detail
Acknowledgments
This image is the copyrighted work of the attributed author or publisher, and
ZFIN has permission only to display this image to its users.
Additional permissions should be obtained from the applicable author or publisher of the image.
Full text @ Elife