Papp-aa proteinase activity is in NaR cells critical.
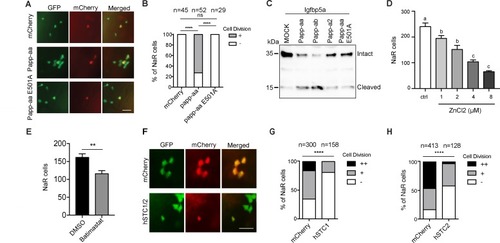
(A–B) Progeny of papp-aa+/-;Tg(igfbp5a:GFP) intercrosses were injected with BAC(igfbp5a:mCherry) containing the indicated gene. They were subjected to the low [Ca2+] stress test described in Figure 2A. Papp-aa-IRES-mCherry, Papp-aa E501A-IRES-mCherry, or mCherry expressing NaR cells were detected by GFP and mCherry expression. NaR cells expressing mCherry or Papp-aa-mCherry (yellow, double labeled by GFP and mCherry) were scored following a published scoring system (Liu et al., 2018). Representative images are shown in (A) and quantified data in (B). Scale bar = 50 µm. +, one cell division, -, no division. ****, p<0.0001 by Chi-square test. The total cell number is shown above the bar. (C) Conditioned media collected from HEK293 cells co-transfected with Igfbp5a and the indicated plasmid were analyzed by western blotting. Intact and cleaved Igfbp5a bands were indicated. (D–E) Tg(igfbp5a:GFP) fish were transferred to the low [Ca2+] medium containing 0–8 µM ZnCl2 (D) or 200 µM Batimastat at three dpf (E). After two days of treatment, NaR cells were quantified and shown. n = 18 ~ 25 fish/group. **, p<0.001 by unpaired two-tailed t test. (F–H) Tg(igfbp5a:GFP) embryos were injected with BAC(igfbp5a:mCherry, BAC(igfbp5a:hSTC1-IRES-mCherry) (G) or BAC(igfbp5a:hSTC2-IRES-mCherry) (H). They were raised and subjected to the low [Ca2+] stress test described in Figure 2A. NaR cells expressing mCherry or human STC (yellow, double labeled by GFP and mCherry) were scored following a published scoring system (Liu et al., 2018). Representative images are shown in (F) and quantified results in (G and H). ++, two cell division, +, one cell division, -, no division during the experiment. ****, p<0.0001, Chi-square test. Total cell number is shown above the bar.
Excel spreadsheet containing quantitative data for <xref rid='fig3' ref-type='fig'>Figure 3</xref>.
This image is the copyrighted work of the attributed author or publisher, and
ZFIN has permission only to display this image to its users.
Additional permissions should be obtained from the applicable author or publisher of the image.
Full text @ Elife
Your Input Welcome
Thank you for submitting comments. Your input has been emailed to ZFIN curators who may contact you if
additional information is required.
Oops. Something went wrong. Please try again later.