|
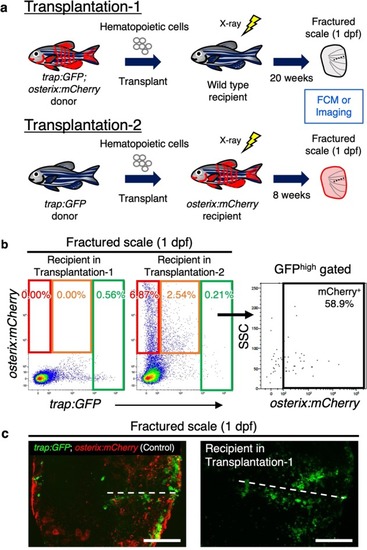
Transplantation assays confirm uptake of OB-derived EVs in OCs.a Schematic diagram of transplantation assays. Hematopoietic cells from trap:GFP; osterix:mCherry double-transgenic zebrafish kidney were transplanted into wild type recipients irradiated with sublethal dose of X-ray (Transplantation-1, n = 3). Hematopoietic cells from trap:GFP single-transgenic zebrafish kidney were transplanted into osterix:mCherry single-transgenic recipients (Transplantation-2, n = 4). After 20 or 8 weeks post-transplantation, cells in scales at 1 day post-fracture (dpf) were analyzed by flow cytometry (FCM) and/or confocal microscopy. b Representative results of FCM analysis in fractured scales from a recipient in Transplantation-1 (left) and recipient in Transplantation-2 (midle). Red, orange, and green gate show trap:GFP−osterix:mCherry+ (“mCh+”), trap:GFPlowosterix:mCherry+ (“GFPlow”), and trap:GFPhigh (“GFPhigh”) cells, respectively. GFPhigh cells in a recipient of Transplantation-2 are displayed in an osterix:mCherry vs. side scatter (SSC) dot plot (right panel). c Representative images of a fractured scale from a trap:GFP; osterix:mCherry double-transgenic animal (left) and recipient in Transplantation-1 (right). Dotted lines indicate the fracture site. Both images showed merged channels of GFP and mCherry. Bars, 100 μm. Experiments were performed twice with three or four biological replicates in each group.
|