
FIGURE
Fig. 3
- ID
- ZDB-FIG-200424-33
- Publication
- Olender et al., 2020 - A unified nomenclature for vertebrate olfactory receptors
- Other Figures
- All Figure Page
- Back to All Figure Page
Fig. 3
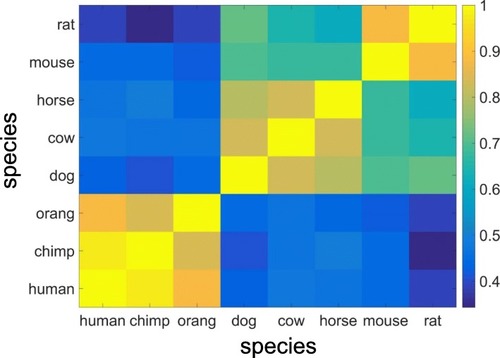
Correlation among the mammalian OR repertoires. The Pearson correlation matrix was calculated using the number of members of each subfamily for each pair of species (Additional file |
Expression Data
Expression Detail
Antibody Labeling
Phenotype Data
Phenotype Detail
Acknowledgments
This image is the copyrighted work of the attributed author or publisher, and
ZFIN has permission only to display this image to its users.
Additional permissions should be obtained from the applicable author or publisher of the image.
Full text @ BMC Evol. Biol.