
Fig. 4
- ID
- ZDB-FIG-200421-15
- Publication
- Espino-Saldaña et al., 2020 - Temporal and spatial expression of zebrafish mctp genes and evaluation of frameshift alleles of mctp2b
- Other Figures
- All Figure Page
- Back to All Figure Page
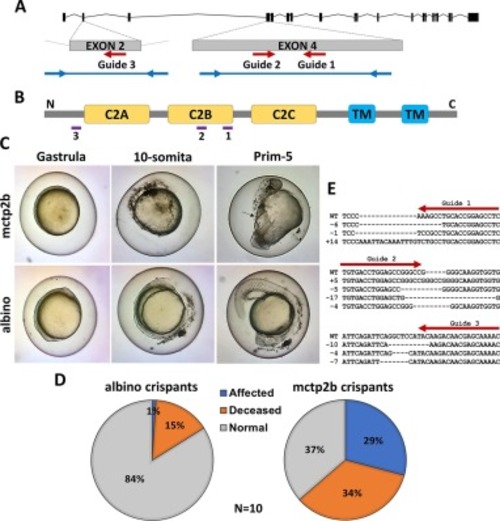
Disruption of mctp2b. (A) Diagram of the zebrafish mctp2b gene showing the location of sgRNA targeting sites. The regions amplified by PCR for genotyping the CRISPR editions are shown in blue lines. (B) Schematic representation of the Mctp2b transcript indicating the position of relevant functional domains and the sites (purple lines) where the CRISPR editions disrupted the protein. (C) Phenotype of mctp2b crispants. (D) Indels found in the genomic DNA sequence of the sgRNA target sites in injected embryos. (E) Percent of normal phenotype, developmental defects (affected) and deceased in albino (control) and mctp2b crispant embryos at 24 hpf. N = 10 independent experiments injecting around 100 embryos per sgRNA per experiment (p < 0.001, Fisher’s exact test). (For interpretation of the references to colour in this figure legend, the reader is referred to the web version of this article.) |
| Fish: | |
|---|---|
| Knockdown Reagents: | |
| Observed In: | |
| Stage Range: | 50%-epiboly to Prim-5 |
Reprinted from Gene, 738, Espino-Saldaña, A.E., Durán-Ríos, K., Olivares-Hernandez, E., Rodríguez-Ortiz, R., Arellano-Carbajal, F., Martínez-Torres, A., Temporal and spatial expression of zebrafish mctp genes and evaluation of frameshift alleles of mctp2b, 144371, Copyright (2020) with permission from Elsevier. Full text @ Gene