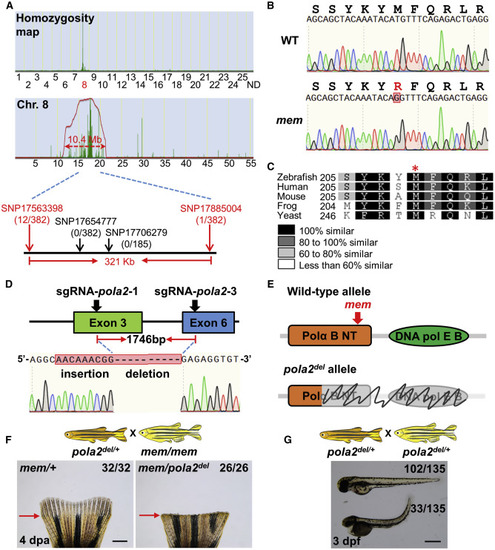
pola2 Is the mem Gene (A) Analysis of genomic homozygosity in mem using SNPtrack. High-resolution mapping of linked SNP markers identified twelve recombinants for SNP17563398 and one recombinant for SNP17885004 separated by a 321-kb region. After genotyping 382 adult animals, no recombinants were found for SNP17654777 or SNP17706279. (B) Sanger sequencing readouts from WT and mem cDNA. SNP17700243 is a novel SNP located in the coding region of the gene DNA polymerase alpha subunit 2 (pola2); it encodes a methionine to arginine substitution. (C) Amino acid alignment across distant species. Red asterisk marks the location of the conserved methionine that is mutated in the mem locus. Differential gray scale shows level of conservation across listed species. (D) Illustration depicting the pola2 genomic sequence we targeted with CRISPR/Cas9. A 1,746-bp deletion was detected by Sanger sequencing of a stable line. (E) Illustration depicting two major structural domains of pola2: DNA polymerase alpha subunit B N-terminal (Polα B NT) and DNA polymerase alpha/epsilon subunit B (DNA pol E B). Top: red arrow indicates the location of the mem mutation. Bottom: gray color and scribble lines indicate structural domains that are removed in the pola2del allele. (F) Complementation assays showing that pola2del allele fails to complement the mem phenotype in adult animals. Approximately 50% of animals (26 out of 58) displayed a complete regeneration block at the restrictive temperature at 4 dpa, as expected from Mendelian ratios. The phenotypes, genotypes, and ratios were consistent across 4 independent crosses (n = 92 in total). Red arrows indicate amputation plane. Scale bar, 1 mm. (G) Representative images of embryos from a pola2del/+ × pola2del/+ cross. Approximately 25% of embryos (33 out of 135) showed developmental defects at 3 dpf (days post-fertilization), consistent with the expected Mendelian ratio. Scale bar, 0.5 mm. See also Figure S2.
|
