
Fig. 1
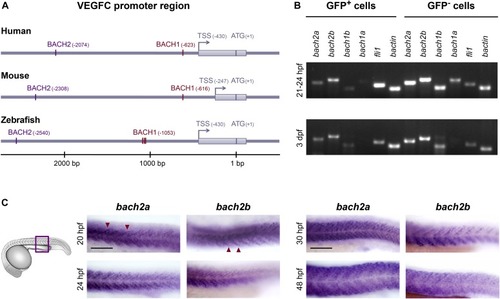
Spatial and temporal expression of bach2 paralog transcripts during zebrafish development. (A) BACH putative binding sites are evolutionarily conserved in the VEGFC promoter region. Numbering is from the ATG (translation initiation) because of the difference in length of the mouse’s 5′ UTR. An arrow indicates transcription start site (TSS), and the location of the first exon is marked as a gray rectangle. The location of the BACH sites is as predicted by Genomatix Genome Analyzer MatInspector: Human (NM_005429.5 TSS at hg19, chr4:177713899 on the minus strand); Mouse (NM_009506.2 TSS at mm9, chr8:54077532 on the plus strand); and Zebrafish (NM_205734.1 TSS at Zv9, chr1:39270725 on the minus strand). (B) Semi-quantitative RT-PCR analysis of the indicated genes (bactin-β actin) in enriched GFP+ cells isolated by FACS from Tg(fli1:EGFP)y1 embryos at two developmental time points, 21–24 hpf and 3 dpf (two independent experiments for each time point). (C) A lateral view of the trunk region of a wild-type zebrafish embryo at 20, 24, 30, and 48 hpf, detected with a specific bach2a or bach2banti-sense mRNA probe. A red arrowhead indicates somite boundaries. Scale bar, 100 μm.
|
| Genes: | |
|---|---|
| Fish: | |
| Anatomical Terms: | |
| Stage Range: | 20-25 somites to Long-pec |