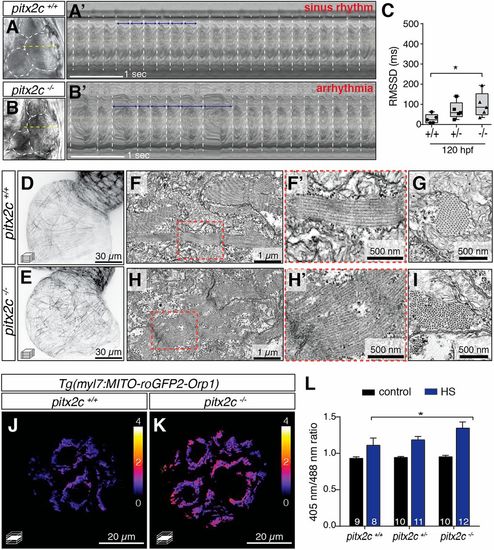
Cardiac arrhythmia in pitx2c−/− larvae is preceded by sarcomere and metabolic defects. (A–C) Analysis of heart rate variability in larval zebrafish using high-speed imaging. Bright-field images of 120-hpf pitx2c+/+ (A) and pitx2c−/− (B) hearts. Representative kymographs of sinus rhythm (A′) and arrhythmia (B′). White dashed lines mark each cardiac cycle; blue arrows denote the duration between consecutive contractions. Box-and-whisker plot of the RMSSD between consecutive cardiac cycles (C). Each data point represents the average interval calculated from 8 to 10 cardiac cycles of individual larvae. Increased variation is observed in pitx2c−/− larvae compared with pitx2c+/+ siblings. Error bars correspond to SEM from at least 2 independent experiments. *P < 0.05 by unpaired t test. (D and E) Confocal images of cardiac sarcomeres in 50-hpf Tg(myl7:LA-EGFP); pitx2c+/+ (D) and pitx2c−/− (E) siblings. (F–I) TEM images of 56-hpf hearts (n = 3); higher magnification of the region outlined in red is shown in F’ and H’. Embryonic sarcomeres appear wavy and less organized in pitx2c−/− compared with pitx2c+/+. (J–L) Redox-state analysis of 120-hpf pitx2c+/+ and pitx2c−/− atria expressing the Tg(myl7:MITO-roGFP2-Orp1) ROS biosensor. Calibration bar shows the relative 405-/488-nm ratio. (L) Quantification of 405-/488-nm ratios in control conditions or following a 1-h HS at 37 °C prior to imaging. Following HS, increased ROS levels were detected in all 3 genotypes; a stronger increase was observed in pitx2c−/− hearts, suggesting increased levels of oxidative stress compared with pitx2c+/+ siblings (L). Error bars correspond to SEM from at least 2 independent experiments. *P < 0.05 by unpaired t test.
|
