|
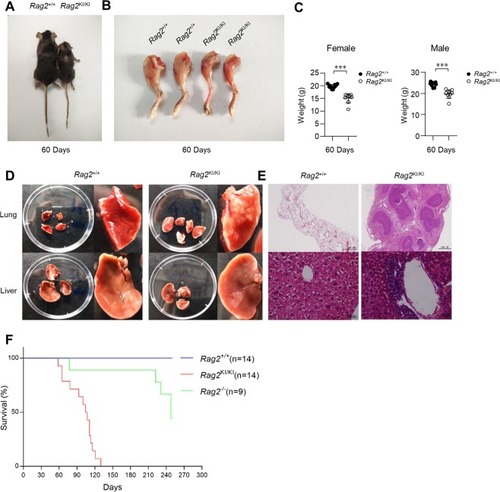
Rag2KI/KI mice develop severe cachexia syndromes. (A) Representative photographs of 2 months old Rag2KI/KI mice and wild-type Rag2+/+ littermates. (B) Skin was stripped from the hind limbs of 60 days old mice for gross comparisons of muscle mass. (C) Total body weight of 2 months old Rag2+/+ mice (n = 9) Rag2KI/KI mice (n = 9). (D) Representative photographs of lungs and livers from 2–5 months old Rag2KI/KI mice and wild-type Rag2+/+ littermates. (E) Representative H&E staining of lung and liver sections at 2–5 months old Rag2KI/KI mice and wild-type Rag2+/+ littermates. (F) Kaplan–Meier curves of Rag2+/+ mice, Rag2KI/KI mice and Rag2−/− mice (Rag2+/+ mice, n = 14; Rag2KI/KI mice, n = 14; Rag2−/− mice, n = 9). Chi square log-rank test was used for statistical analysis. The results are representative of three independent experiments. The error bars indicate the SDs. The data are presented as the mean ± standard deviation. *P < 0.05, **P < 0.01 and ***P < 0.001 by Student’s t test.
|