FIGURE

Figure 2

ID
ZDB-FIG-200226-32
Publication
Chávez et al., 2020 - Autophagy Activation in Zebrafish Heart Regeneration
Other Figures
All Figure Page
Back to All Figure Page
Figure 2

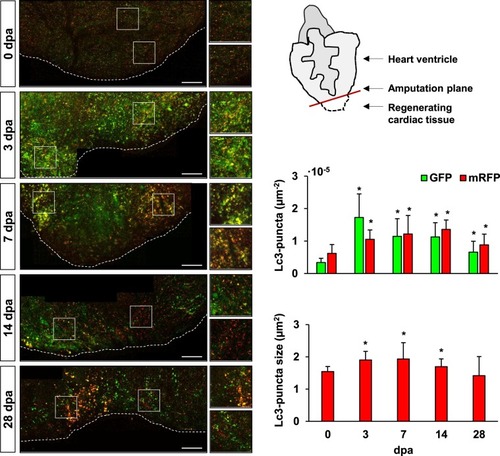
Enhanced accumulation of autophagosomes and phagolysosomes is observed in the injured cardiac tissue upon amputation. The transgenic line Tg(b-actin2:mRFP-GFP-Lc3) allows the observation of autophagosome formation and processing in the regenerating zebrafish heart ventricle at different time points after apex amputation. Autophagosomes are depicted both as GFP- and RFP-puncta, while the lower pH-sensitivity of RFP additionally allows the visualization of phagolysosomes. Images were taken immediately after heart excision, and upon overnight incubation of the zebrafish in 2 mM CQ, which acts as a lysosomal inhibitor. Quantitative analysis revealed a significant increase in the number of both vesicles, as well as in the average autophagosome/phagolysosome size (red puncta) in the regenerating tissue, which gradually decreased over time. A schematic view of the ventricle orientation and the region of interest considered for image acquisition is shown, while higher magnifications exemplifying the accumulation of bigger autophagic vesicles are presented next to the mosaic images. Scale bars represent 200 μm. *p ≤ 0.05. N ≥ 3.

Expression Data

Expression Detail
Antibody Labeling
Phenotype Data

Phenotype Detail
Acknowledgments
This image is the copyrighted work of the attributed author or publisher, and ZFIN has permission only to display this image to its users. Additional permissions should be obtained from the applicable author or publisher of the image. Full text @ Sci. Rep.