|
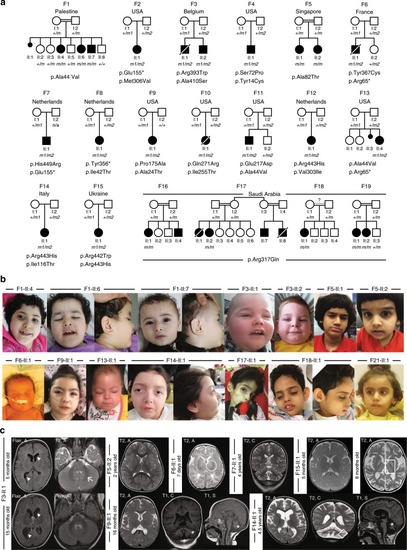
Clinical and genetic findings in 21 affected individuals diagnosed with Jamuar Syndrome consisting of developmental epileptic encephalopathy.a Pedigrees of 19 families segregating autosomal recessive developmental epileptic encephalopathy. Countries of origin are specified above each pedigree. Filled black symbols, affected individuals. Crossed symbols, deceased individual. Mutations in UGDH protein are presented below pedigrees. Homozygous mutations are presented in bold (m in the pedigrees). Compound heterozygous mutations are presented according to the parental origin of the mutation with a maternal origin in the first row (m1 in the pedigrees), and a paternal, de novo or unknown origin in the second row (m2 in the pedigrees). Healthy siblings that could be sequenced are heterozygous [F6-II:2 (p.Arg65*), F11-II:2 (p.Ala44Val), and F18-II:3 (p.Arg317Gln)]. b Facial photographs of 14 affected individuals with mild craniofacial dysmorphisms, including short and flattened philtrum, protruding earlobes, ptosis blepharophimosis, and epicanthic folds. c Spectrum of MRI findings in exemplary patients showing no evidence for maldevelopment but displaying variable abnormalities ranging from abnormal myelination and/or cerebral or cerebellar atrophy, to normal findings. Patient F5-II:2 presented with a normal MRI, including normal myelination at 2 years of age. In contrast, MRI of patient F3-II:1 revealed some myelination of cerebellar peduncles at 5 months (arrow) and no progress of myelination on follow-up at 15 months, indicative of hypomyelination. In addition, repeated MRI revealed enlarged posterior ventricles over time (arrow heads). MRI of patient F6-II:1 at 7 days of age also proved normal, the circle indicates onset of myelination in the Posterior Limb of the Internal Capsule (PLIC) according to age. Patient F7-II:1 showed mild cerebellar atrophy at 4 years of age. Patient F9-II:1 showed slightly delayed myelination on axial T2 and cerebellar atrophy on coronal and sagittal T1 images (stars). Patient F14-II:1 showed a diffuse cerebral atrophy, ventriculomegaly, thin corpus callosum, vermian, and lobar cerebellar atrophy, with normal brainstem, hyperintensity of cerebellar cortex in T2-weighted images (white square). Patient F15-II:1 presented with normal MRI at 5 months, but with severe diffuse atrophy, bilateral symmetrical hyperintensities of thalami and globus pallidus (white square) at 8 months old. In all pictures, MRI pulse sequences (T1, T2, and Flair) and image orientation (S: sagittal, A: axial and C: coronal) are indicated in the upper left corner.
|