FIGURE

Figure 1

ID
ZDB-FIG-191230-722
Publication
Fitzgerald et al., 2019 - Emergence of consistent intra-individual locomotor patterns during zebrafish development
Other Figures
All Figure Page
Back to All Figure Page
Figure 1

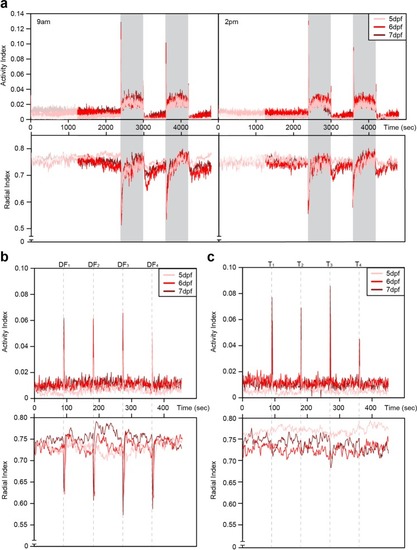
Time series plots from behavior experiments. (a) Average activity index (top) and radial index (bottom) per second of 132 zebrafish larvae over the study period under light or dark period at either 9 am (left) or 2 pm (right) for 5, 6 or 7 dpf. Initial 20 minutes acclimation period (faded period), followed by 20 minutes of “spontaneous” swimming, then swimming under darkness (2 × 10 min, referred to as “dark intervals”, shaded period) and swimming in light after periods of darkness (2 × 10 min, referred to as “light intervals”). For the startle triggers of (b) dark flashes (DF) and (c) tapping (T), average activity for 9 am measurements are shown. The dashed grey lines indicate occurrence of the stimuli.

Expression Data

Expression Detail
Antibody Labeling
Phenotype Data

Phenotype Detail
Acknowledgments
This image is the copyrighted work of the attributed author or publisher, and ZFIN has permission only to display this image to its users. Additional permissions should be obtained from the applicable author or publisher of the image. Full text @ Sci. Rep.