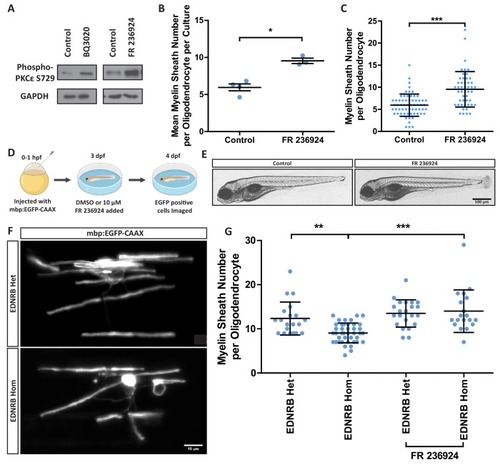
(A) Western blot images of rat oligodendrocytes treated with EDNRB agonist BQ3020 and PKCε agonist FR 236924 for 15 min. Antibodies used: Phosphorylated PKCε S729 and loading control GAPDH. (B) Mean number of myelin sheaths formed by rat oligodendrocytes on microfibers per experiment. Control 5.959 ± 0.4708 n = 4, FR 236924 9.542 ± 0.3614 n = 3 (mean ± standard error). Unpaired T-test p=0.0024. (C) Pooled data for number of myelin sheaths formed by rat oligodendrocytes on microfibers. Control 5.952 ± 2.525 n = 62 cells from four experiments, FR 236924 9.542 ± 4.016 n = 48 from three experiments (mean ± standard deviation). Mann-Whitney test, p=<0.001. (D) Schematic for zebrafish larvae treatment with FR 236924. (E) Representative images of 4 dpf zebrafish larvae treated with DMSO control or FR 236924. Scale bar = 500 μm. (F) Representative images of mbp:EGFP-CAAX oligodendrocytes in four dpf zebrafish larvae. Scale bar = 10 μm. (G) Pooled data for number of myelin sheaths formed by zebrafish oligodendrocytes. EDNRB Het 12.35 ± 3.746 n = 20 cells, EDNRB Hom (rse) 9.073 ± 2.229 n = 41 from four experiments, EDNRB Het + FR 236924 13.5 ± 3.098 n = 22 cells from five experiments, EDNRB Hom + FR 236924 14 ± 4.807 n = 19 cells (mean ± standard deviation). 1-way ANOVA
|
