FIGURE

FIGURE 2

ID
ZDB-FIG-191230-1130
Publication
Vecchia et al., 2019 - Reelin Signaling Controls the Preference for Social Novelty in Zebrafish
Other Figures
All Figure Page
Back to All Figure Page
FIGURE 2

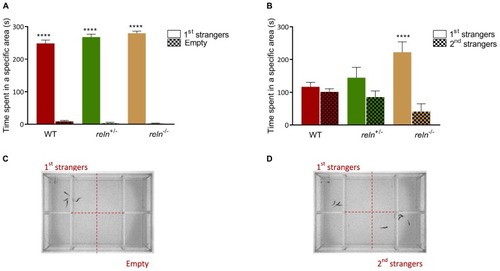
Social preference test. (A) Social preference. WT, reln+/– and reln–/– show a significant preference to spend time near a group of unfamiliar fish [1st strangers; p < 0.0001 for all genotypes; two-way ANOVA followed by Sidak’s post hoc, genotype factor: F(2,62) = 1.818, p = 0.17, stranger factor: F(1,62) = 2392, p < 0.0001, interaction genotype × stranger: F(2,62) = 4.418, p = 0.02]. (B) Preference for social novelty. Both WT and reln+/– spend an equal amount of time near both groups of unfamiliar fish (1st and 2nd strangers; p = 0.99 for WT and p = 0.38 for reln+/–). reln–/– do not switch preference to the second group of unfamiliar fish [2nd strangers; p < 0.0001; two-way ANOVA followed by Sidak’s post hoc, genotype factor: F(2,62) = 0.5184, p = 0.60, stranger factor: F(1,62) = 21.49, p < 0.0001, interaction genotype × stranger: F(2,62) = 6.886, p = 0.002]. n = 12 wild-type, n = 12 reln+/– and n = 10 reln–/–. ****p < 0.0001. Mean ± SEM. (C,D) Photographs showing the experimental setup for social preference (C) and preference for social novelty (D).

Expression Data

Expression Detail
Antibody Labeling
Phenotype Data
Fish:
Observed In:
Stage: Adult

Phenotype Detail
Acknowledgments
This image is the copyrighted work of the attributed author or publisher, and ZFIN has permission only to display this image to its users. Additional permissions should be obtained from the applicable author or publisher of the image. Full text @ Front. Behav. Neurosci.