
Fig. 5
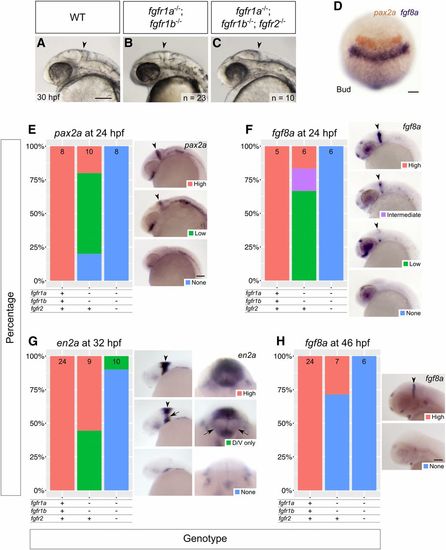
fgfr1a, fgfr1b, and fgfr2 function redundantly to regulate MHB development. (A–C) Lateral view of 30 hpf wild-type (WT, A), and fgfr1a−/−;fgfr1b−/− (B; n = 23), fgfr1a−/−;fgfr1b−/−;fgfr2−/− (C; n = 10) mutant embryos. Arrowheads denote region where the MHB should form. Rostral is to the left, dorsal is up. (D–H) MHB marker analysis of fgfr double and triple mutant embryos at the bud stage (pax2a in brown/fgf8a in purple, D), 24 hpf (pax2a, E; fgf8a, F), 32 hpf (en2a, G), and 46 hpf (fgf8a, H). Whole mount in situ hybridization was performed, embryos were scored for expression, and genotypes were determined post hoc. All embryos had indistinguishable pax2a/fgf8a expression at the bud stage (D; n = 28, 6, 4, for WT, fgfr1a−/−;fgfr1b−/−, and fgfr1a−/−;fgfr1b−/−;fgfr2−/−, respectively). In (E–H), the percentage of embryos expressing particular levels of each marker gene is represented in a stacked column chart on the left (sample size for each genotype is listed at the top of each bar), and representative images of those expression levels are shown for each marker to the right (lateral views, rostral to the left and dorsal up; developing MHBs are denoted by arrowheads). Rightmost images in (G) are magnified frontal views (dorsal up) showing low en2a staining in the left and right regions of the cerebellum (arrows). Bars: in (A), 100 μm for (A–C); in (D), 100 μm; in (E), 100 μm for (E–G); in (H), 100 μm. |
| Fish: | |
|---|---|
| Observed In: | |
| Stage: | Prim-15 |