
FIGURE
Fig. S1
- ID
- ZDB-FIG-190913-6
- Publication
- Zhang et al., 2019 - Transcriptomic profile of early zebrafish PGCs by single cell sequencing
- Other Figures
- All Figure Page
- Back to All Figure Page
Fig. S1
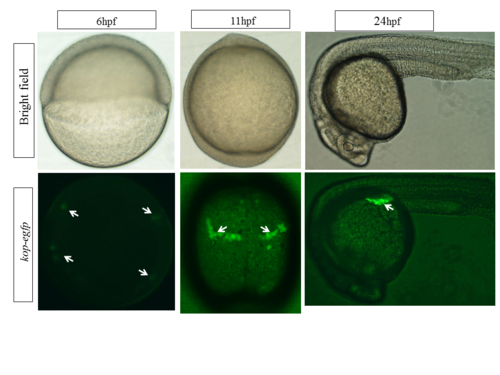
Images for the zebrafish embryos in this study.White arrows pointing to cells emitting green fluorescence means PGCs. Images of the up panel are taken under bright light, and images of the down panel are taken under fluorescent light. |
Expression Data
Expression Detail
Antibody Labeling
Phenotype Data
Phenotype Detail
Acknowledgments
This image is the copyrighted work of the attributed author or publisher, and
ZFIN has permission only to display this image to its users.
Additional permissions should be obtained from the applicable author or publisher of the image.
Full text @ PLoS One