
Fig. 3
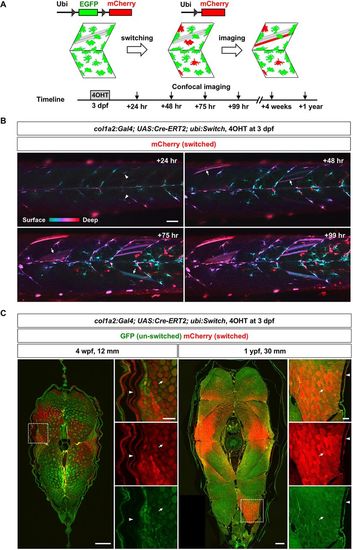
col1a2+ cells contribute to muscle growth. (A) Schematics of Cre-mediated lineage tracing experiments. (B) col1a2Cre-ERT2; ubi:Switch embryos were pulsed with 4-OHT for 2 h at 3 dpf to induce EGFP excision, and imaged for 4 days. Color-coded depth projections of mCherry expression are shown. ‘Switched’ mCherry+ MPCs (arrowheads) at the +24 h time point generated new mCherry+ myofibers (arrows) starting from the +48 h time point. n=20 embryos. (C) ‘Switched’ col1a2Cre-ERT2; ubi:Switch fish were sectioned and imaged at 4 wpf (n=4 fish at 12 mm SL) and 1 ypf (n=4 fish at 30 mm SL). Transverse sections (stitched confocal tile scans) with expanded views of boxed regions are shown. Arrows denote mCherry+ myofibers and arrowheads indicate the mCherry+ skin. Scale bars: 50 µm (B,C) and 200 µm (full views in C). |