
Fig. 5
- ID
- ZDB-FIG-190813-10
- Publication
- Princely Abudu et al., 2019 - NIPSNAP1 and NIPSNAP2 Act as "Eat Me" Signals for Mitophagy
- Other Figures
- All Figure Page
- Back to All Figure Page
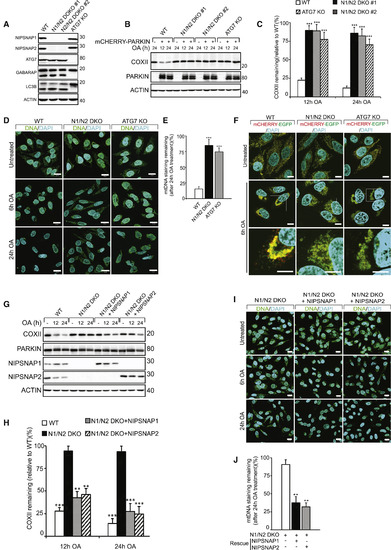
NIPSNAP1 and NIPSNAP2 Are Required for Mitophagy (A) CRISPR-Cas9-mediated double knockout of NIPSNAP1 and NIPSNAP2 (N1/N2 DKO) or ATG7 in HeLa cells were confirmed by immunoblotting. The effect of ATG7 KO on autophagy was confirmed by immunoblotting against LC3B and GABARAP. (B) WT, N1/N2 DKO, and ATG7 KO HeLa cells with or without mCherry-PARKIN expression were treated with OA for 12 or 24 h and extracts immunoblotted as indicated. (C) Densitometry of COXII protein levels relative to WT in (B). Values are mean ± SD ∗∗∗p < 0.001, one-way ANOVA. (D) Representative images of mCherry-Parkin expressing WT, N1/N2 DKO and ATG7 KO cells treated with OA for 6 or 24 h, immunostained for mtDNA nucleoids (green) and DAPI (blue). Scale bars are 20 μm. (E) Quantification of mtDNA nucleoid staining shown in (D) from three independent experiments. More than 100 cells were quantified per sample. Values are mean ± SD ∗∗∗p < 0.001, one-way ANOVA. (F) WT, N1/N2 DKO, and ATG7 KO HeLa cells stably expressing the mCherry-EGFP-OMP25TM mitophagy reporter were left untreated or treated with OA for 6 h and analyzed by confocal microscopy. Scale bars are 10 μm. (G) mCherry-PARKIN expressing WT, and N1/N2 DKO HeLa cells were rescued or not with untagged NIPSNAP1 or NIPSNAP2, followed by treatment with OA for 12 or 24 h and immunoblotting. (H) Quantification of COXII levels relative to WT from data shown in (F). Values are mean ± SD ∗∗∗p < 0.001, ∗∗p < 0.005, one-way ANOVA. (I) Representative images of mCherry-PARKIN expressing N1/N2 DKO cells rescued or not with NIPSNAP1 or NIPSNAP2 treated with OA for 6 or 24 h, then immunostained for mtDNA nucleoids (green) and DAPI (blue). Scale bars are 20 μm. (J) Quantification of mtDNA staining of data shown in (I). More than 100 cells were quantified per sample. Similar results were obtained in three independent experiments. Values are mean ± SD ∗∗p < 0.005, one-way ANOVA. |
Reprinted from Developmental Cell, 49(4), Princely Abudu, Y., Pankiv, S., Mathai, B.J., Håkon Lystad, A., Bindesbøll, C., Brenne, H.B., Yoke Wui Ng, M., Thiede, B., Yamamoto, A., Mutugi Nthiga, T., Lamark, T., Esguerra, C.V., Johansen, T., Simonsen, A., NIPSNAP1 and NIPSNAP2 Act as "Eat Me" Signals for Mitophagy, 509-525.e12, Copyright (2019) with permission from Elsevier. Full text @ Dev. Cell