
Fig. 3
- ID
- ZDB-FIG-190812-5
- Publication
- Morioka et al., 2018 - Efferocytosis induces a novel SLC program to promote glucose uptake and lactate release
- Other Figures
- All Figure Page
- Back to All Figure Page
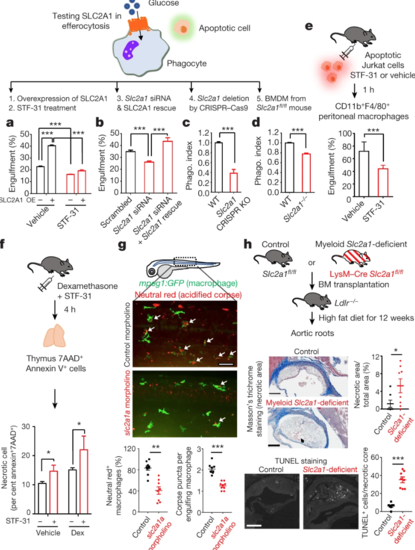
a, Overexpression of SLC2A1 in BMDMs increases efferocytosis. Treatment with the SLC2A1 inhibitor STF-31 reduces phagocytosis and abolishes the effect of SLC2A1 overexpression (OE). b, Slc2a1 siRNA inhibits efferocytosis; this effect is rescued by co-transfection with siRNA-resistant Slc2a1 cDNA. c, SLC2A1 knockout by CRISPR–Cas9 causes a decrease in phagocytosis of apoptotic cells in LR73 cells. WT, wild type. d, SLC2A1 deletion in BMDMs from Slc2a1fl/fl mice using TAT-Cre inhibits phagocytosis. Phagocytosis index = per cent engulfment (experimental/control). Data from ≥ 2 independent experiments with 3–4 replicates per condition. e, Treatment with the SLC2A1 inhibitor STF-31 reduces efferocytosis in vivo. f, STF-31 promotes accumulation of necrotic thymocytes after dexamethasone-induced apoptosis in vivo. Data represent two independent experiments with 3–4 mice per group. g, Targeting the Slc2a1 orthologue reduces efferocytosis in zebrafish. Tg(mpeg1:GFP) embryos were injected with control or slc2a1a morpholino. Neutral red was used to preferentially stain acidic organelles. slc2a1a-targeted morphants (50 h post fertilization (hpf)) displayed less apoptotic cell engulfment (neutral red+ GFP-labelled macrophages) in the trunk region. Three areas and three fish per group. Data are mean ± s.d. Scale bar, 50 µm. h, Increased necrotic atherosclerotic area and TUNEL+ cells after myeloid-specific deletion of Slc2a1. Top, schematic of bone marrow chimaeras using Slc2a1fl/fl and LysM–Cre Slc2a1fl/fl mice. Middle, serial interrupted 5-µm sections stained with Masson’s Trichrome. Representative photomicrographs and quantification of necrotic core area normalized to total area. Bottom, TUNEL staining and quantification of TUNEL+ cells per necrotic core. Data are mean ± s.e.m. of 7–8 mice per group . Scale bar, 200 µm. |
| Fish: | |
|---|---|
| Knockdown Reagent: | |
| Observed In: | |
| Stage: | Long-pec |