
Fig. 5
- ID
- ZDB-FIG-190809-27
- Publication
- Crilly et al., 2019 - Using Zebrafish Larvae to Study the Pathological Consequences of Hemorrhagic Stroke
- Other Figures
- All Figure Page
- Back to All Figure Page
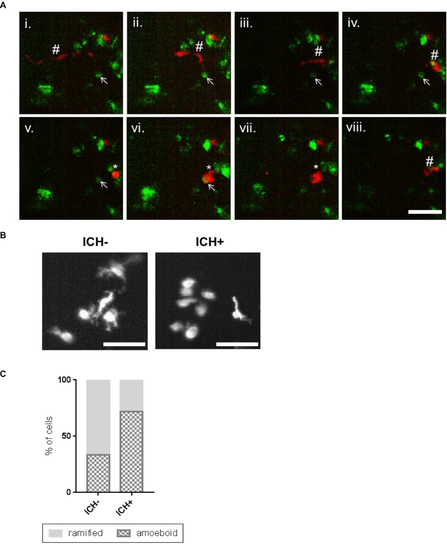
Activated macrophage cells show a phagocytic response to the brain lesion. (A) Representative time-lapse stills20 showing a ramified patrolling macrophage migrating towards an annexinV positive cell (i - vi). Stills are obtained from a series of images taken of the whole brain using a 20x objective. Scale bar represents 50 µm. The macrophage acquired an amoeboid morphology (v) before phagocytosing the annexinV-positive cell (vi, vii). After phagocytosis the macrophage resumes a ramified morphology and migrates away and the annexinV-positive cell can no longer be seen (viii). Ramified macrophage (#), annexinV positive cell (arrow), amoeboid macrophage (*) are indicated. (B) Representative images of mpeg1-positive cells in the ICH- and ICH+ larval brain exhibiting amoeboid and ramified morphologies. Scale bars represent 50 µm. (C) An increased proportion of amoeboid (phagocytic) and decreased proportion of ramified (inactive) macrophages was observed in ICH+ brains in comparison to ICH- siblings. Figure has been reproduced from Crilly et al.20 with permission under a Creative Commons license. |