
Fig. 5
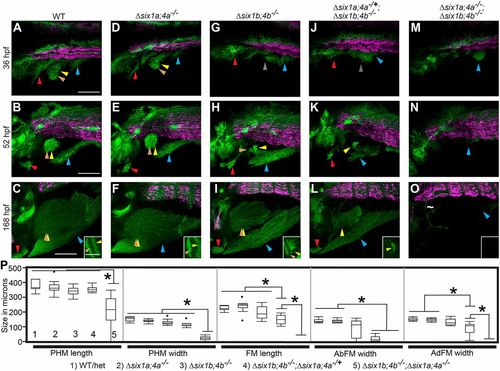
six1/six4 genes function in a largely redundant fashion for normal MMP migration. (A-O) Confocal projections showing six1b:lyn-GFP (green) and slow muscle smyhc1:lyn-tdTomato (magenta) expression in embryos fixed at the indicated time-points. (A-F) Wild-type (A-C) and Δsix1a;4a homozygote (D-F) MMP streams and MMP-derived muscles are similar at all time points. (G-L) MMP streams and MMP-derived muscles are moderately reduced in Δsix1b;4b homozygotes (G-I) and further reduced in Δsix1b;4b homozygotes that are heterozygous for the Δsix1a;4a deficiency (J-L). (M-O) MMP streams and almost all MMP-derived muscle fibers are absent Δsix1a;4aΔsix1b;4b mutant homozygotes. The few GFP-positive cells within the fin of Δsix1a;4a;Δsix1b;4b mutants do not have muscle fiber morphology (tilde in panel O). Insets in C,F,I,L,O show a single z-section through the fin to distinguish the AbFM and AdFM muscles. (P) Box plots showing measurements of muscles at 7 days post-fertilization; asterisks indicate significant differences (P<0.01) as determined by Tukey–Kramer HSD comparisons after one-way ANOVA. For each measurement, genotypes are labeled 1-5 (see key under the plot), with 1 indicating wild type and 5 indicating Δsix1a;4a;Δsix1b;4b mutant. n=12 embryos measured per group. See Materials and Methods for statistical details. Arrowheads are color-coded as described in Fig. 1. Scale bars: 100 µm. |