|
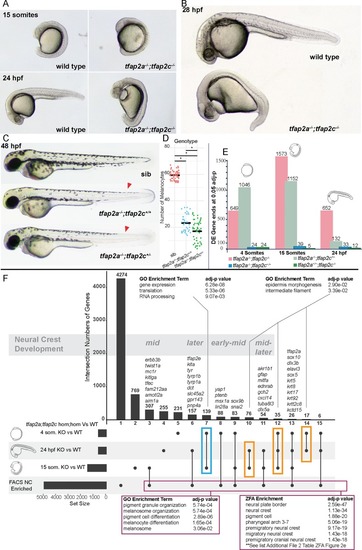
Molecular profiling of <italic>tfap2a</italic>;<italic>tfap2c</italic> mutants across multiple time points using 3’ tag sequencing.(A) tfap2a-/-;tfap2c-/- mutants present the first morphological phenotypes at the 15 somite stage. (B) By 28 hpf the morphological phenotype leads to an overall dorsalised form, bifurcation of the forming eye, heart oedema, and complete lack of neural crest cells. All other genotypes appear normal. (C) At 48 hpf the previously described reduction of melanocytes can be noted in tfap2a-/-;tfap2c+/+ embryos and a modest reduction of melanocytes can be identified in the dorsal tail (red arrow heads) in tfap2a-/-;tfap2c+/- mutants. (D) Quantification of melanocytes in the three corresponding genotypes at 36 hpf. (E) Chart indicating the number of differentially expressed gene 3’ ends identified with an adjusted p-value of <0.05 for each pairwise comparison of genotypes tfap2a-/-;tfap2c-/-, tfap2a-/-;tfap2c+/-, tfap2a-/-;tfap2c+/+ and tfap2a+/+;tfap2c-/- to tfap2a+/+;tfap2c+/+ siblings at 4 somites, 15 somites and 24 hpf (F) An UpSet[53] diagram to compare multiple pairwise DE gene lists derived from the tfap2a-/-;tfap2c-/- vs wild-type siblings (adj. p-value <0.05) for the 4 somite, 15 somite and 24 hpf stages and the list of neural crest-enriched genes derived from sorted neural crest cells at 22–23 hpf. The horizontal black bars represent the size of the gene lists. Individual subsets are marked with a black dot and overlaps with a connecting line. The number of genes in each subset is shown above each vertical bar. The vertical bars are numbered consecutively along the x-axis. GO/ZFA enrichment was carried out on the subset of the 4 and 15 somite stages (blue box), the subsets indicated with the orange boxes and on all genes contained in the neural crest FACS enrichment and in at least one of the three different double knockout time points (magenta box). The developmental time course nature of the data allows for the grouping of the subsets into timing based on neural crest development starting with early neural crest-specific gene expression and then moving towards early-mid, mid, mid-later and later. The complete list of the 26 genes in group 13 can be found in S2 Table.
|