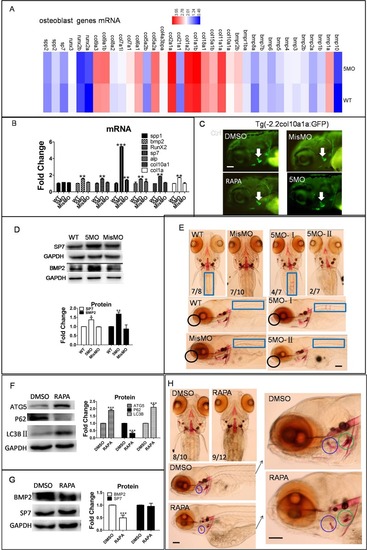
Osteoblast differentiation was regulated by autophagy in zebrafish larvae. (A–E) Embryos or transgenic Tg (-2.2col10a1a:GFP) embryos were injected with 5MO and MisMO at the 1–4 cell stage, and larvae were collected at 6 dpf for transcriptom sequencing, qPCR, western blot and Alizarin Red staining, transgenic larvae were collected at 4 dpf for image capture. (A) Heat map showed osteoblast-related genes mRNA level, data were from transcriptome sequencing. (B) Transcriptional level of osteoblast genes were detected by qPCR. (C) Col10a1a expression pattern in transgenic zebrafish larvae at 4 dpf. (D) Osteoblast proteins SP7 and BMP2 were detected by western blot. (E) Alizarin Red staining showed the mineralization of osteoblast at larvae den and rib. 5MO-II:abnormal phenotype. (F–H) Larvae were exposed to 50 µM RAPA at 3 dpf, larvae were collected at 6 dpf for western blot and staining assay separately. (F,G) Western blot assay showed autophagy proteins and osteoblast proteins were changed by RAPA. (H) Alizarin Red staining showed osteoblast mineralization. Black circle, dentary (den); blue rectangle, rib; blue circle, opercle (op); green circle, ceratobranchial 5 (cb5). The means and s.d. were derived from triple duplicates, *P<0.05, **P<0.01, ***P<0.001 versus WT groups (one-way ANOVA). The data of western blots were from three independent experiments. Scale bars: 50 µm.
|
