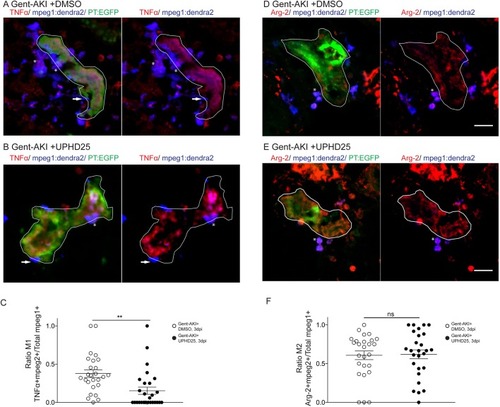
UPHD25 treatment reduces total M1 macrophage population, but not M2 macrophage population.Tg(mpeg1:dendra2); Tg(PT:EGFP) transgenic zebrafish were used for macrophage polarization analysis. (A,B) Immunofluorescence co-stain of TNFα (red), macrophages (blue) and PT (green) in gent-AKI+DMSO (A) and gent-AKI+UPHD25 (B). PTs are outlined in white. TNFα+/mpeg+ are marked with an asterisk and TNFα−/mpeg1+ are marked with an arrow. (C) Quantification of M1 macrophage recruitment by counting TNFα+/mpeg1+ cells adjacent to the PT. MeanGent-AKI+DMSO=0.38 (N=26) vs MeanGent-AKI+UPHD25=0.15 (N=28). (D,E) Immunofluorescence co-stain of arginase-2 (red), macrophages (blue) and PT (green) in gent-AKI+DMSO (D) and gent-AKI+UPHD25 (E). Arg2+/mpeg1+ are marked with an asterisk. (F) Quantification of M2 macrophage recruitment by counting Arg-2+/mpeg1+ cells adjacent to the PT. MeanGent-AKI+DMSO=0.61 (N=26) vs MeanGent-AKI+UPHD25=0.62 (N=27). Macrophage numbers were normalized by calculating the ratio of M1 or M2 over total macrophages; i.e. (TNFα+/mpeg1+)/total mpeg1+. Data pooled from three biological replicates are shown expressed as mean±s.e.m. Two-tailed t-test: **P<0.01, ns, not significant. Scale bars: 20 μm.
|
