
Fig. 3
- ID
- ZDB-FIG-190722-13
- Publication
- Stankiewicz et al., 2019 - Cell kinetics in the adult neurogenic niche and impact of diet-induced accelerated aging
- Other Figures
- All Figure Page
- Back to All Figure Page
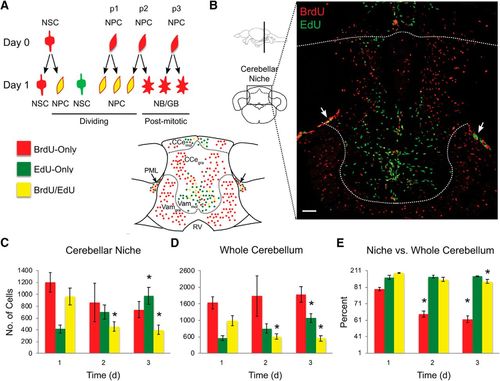
Daily proliferative activity in the brain of normal 1-year-old zebrafish. Cell proliferation in the cerebellum over a 1 to 3 d BrdU/EdU pulse-chase. A, Schematics of representative cell division modes and cell color on the day of BrdU pulse (day 0) and EdU chase (day 1). RV, Rhombencephalic ventricle. B, Representative image of labeled cells in the cerebellar niche and outside parenchyma on day 3 of BrdU/EdU pulse-chase, and corresponding schematics. Arrows indicate posterior mesencephalic layer (PML). Scale bar, 50 μm. C, Number of labeled cells in the cerebellar neurogenic niche. D, Number of labeled cells in the whole cerebellum. E, Percentage of labeled cells in the neurogenic niche versus whole cerebellum. Cell counts conducted in brain sections. Red represents BrdU-only. Green represents EdU-only. Yellow represents BrdU/EdU colocalized. N = 5 or 6 fish per time point. Data are mean ± SEM. *p < 0.05, relative to day 1. |