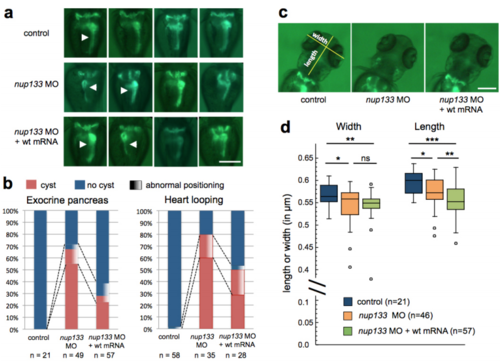
Unlike the appearance of kidney cysts, the Left-Right patterning defects and the mild alteration of head size observed in nup133 morphants are not rescued by wt nup133 mRNA. (a, c) Dorsal view of (a) the bodies and (c) the heads of 3dpf Tg(wt1b:EGFP) embryos injected with control or nup133 MO, or sequentially injected with 3xHA-mCherry-Dr nup133 mRNA and nup133 MO (nup133 MO + wt mRNA). Overlays of transmission and GFP-signal images are presented. In (a), arrowheads point to the exocrine pancreas that is located on the right side of control larvae, but is sometimes misplaced towards the left side in nup133 MO injected embryos, injected or not with 3xHA-mCherry-Dr nup133 mRNA. (b) The presence of glomerular cysts and either the abnormal positioning of the exocrine pancreas (left panel) or heart looping (right panel) were recorded on the indicated number of 3 dpf and 2 dpf larvae, respectively. The exocrine pancreas was scored as normal, when positioned to the right and as "abnormal positioning" when positioned to the left or in the midline. Heart looping was scored as normal if the ventricle was on the right of the atrium (D-looping), and as "abnormal positioning" if the ventricle was either on the left of the atrium (L loop) or if it failed to bend (no-loop). In (c), the yellow lines on the control larva corresponds to the lines drown in Image J to measure the width and length of embryos heads. (d) Length and width of the heads were measured from the indicated number of control, nup133 MO and nup133 MO+wt mRNA larvae. Box plots were generated using KaleidaGraph (Synergy Software): each box encloses 50% of the normalized values obtained, centered on the median value. The bars extending from the top and bottom of each box mark the minimum and maximum values within the dataset falling within an acceptable range. Values falling outside of this range are displayed as an individual point. Statistical analyses were performed using Wilcoxon-Mann-Whitney Rank Sum Test provided by the KaleidaGraph software. Standard conventions for symbols indicating statistical significance are used: ns, not significant: P> 0.05; *:P ≤ 0.05, ** :P ≤ 0.01, *** :P ≤ 0.001. Images and regions used for quantification of exocrine pancreas positioning and head sizes are available at Mendeley under doi:10.17632/j78ddshctz.1
|
