
Fig. 4
- ID
- ZDB-FIG-190628-12
- Publication
- Zhao et al., 2019 - In Vivo imaging of β-cell function reveals glucose-mediated heterogeneity of β-cell functional development
- Other Figures
- All Figure Page
- Back to All Figure Page
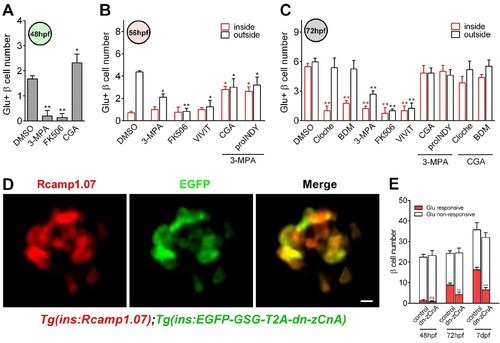
Calcineurin/NFAT signaling acted as the downstream of glucose to initiate and enhance β-cell functionality.(A) Numbers of glucose-responsive β-cells in 48 hpf embryos that had been treated with the indicated reagents. n = 4–8 embryos per condition. *p<0.05, **p<0.01. (B) Numbers of glucose-responsive β-cells in the mantle and the core of the islet in 56 hpf embryos that had been treated with the indicated reagents. n = 5–9 embryos per condition. *p<0.05, **p<0.01. (C) Numbers of glucose-responsive β-cells in the mantle and the core of the islet in 72 hpf embryos that had been treated with the indicated reagents. n = 5–9 embryos per condition. **p<0.01. (D) Representative two-photon images of Rcamp1.07 (left), EGFP (middle) and the merged image (right) of the islet cells in a living Tg (ins:Rcamp1.07);Tg (ins:EGFP-GSG-T2A-dn-zCnA) embryo. (E) Numbers of glucose-responsive β-cells in age-matched controls and dn-zCnA-expressing embryos at 48 hpf, 72 hpf and seven dpf. n = 4–6 embryos per stage. **p<0.01, ***p<0.001; ns, not significant. Scale bar: 10 μm. See also Figure 4—figure supplements 1–2 and Videos 5–6. |