
Fig. 5
- ID
- ZDB-FIG-190627-18
- Publication
- Tabor et al., 2019 - Brain-wide cellular resolution imaging of Cre transgenic zebrafish lines for functional circuit-mapping
- Other Figures
- All Figure Page
- Back to All Figure Page
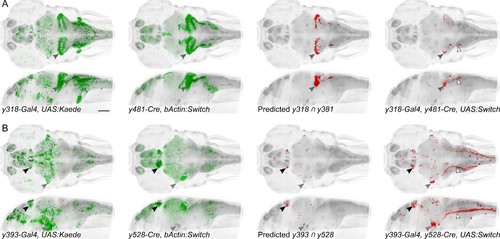
Spatially restricted reporter expression in Gal4/Cre intersectional domains.Maximum projections for et-Gal4 and et-Cre lines predicted to show co-expression in small domains of neurons, and of the resulting pattern of expression in a triple transgenic et-Gal4, et-Cre, UAS:KillSwitch larva. Scale bar 100 µm. (A) Horizontal (top) and sagittal (bottom) maximum projections for (left to right): y318-Gal4 expression, y481-Cre expression, predicted reporter distribution in cells that co-express y318 and y481,actual RFP expression in an individual y318, y481, UAS:KillSwitch larva. Closed arrowhead indicates the cerebellar eminentia granularis (Eg), which is labeled in both lines and the intersect. Open arrowhead indicates descending fiber tract from Eg neurons. (B) As for (A) with y393-Gal4 and y528-Cre lines. Closed arrowheads indicate the lateral habenula (black) and trigeminal ganglion (grey). Open arrowhead indicates central projections from the trigeminal ganglion. |