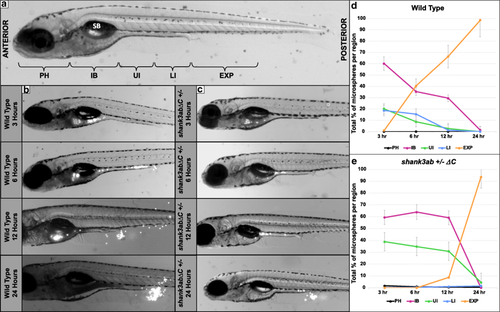
DT transit time of fluorescent beads is prolonged in shank3abΔC+/− mutants compared to WT larvae. a Regions of the DT analyzed for fluorescent bead occupancy are indicated on a 7-day-old zebrafish larva. Beads were tracked as they passed through five key regions: PH (pharynx), IB (intestinal bulb), UI (upper intestine), LI (lower intestine), and EX (expelled). The swim bladder (SB) is labeled for reference. b Images of a representative WT fish at 3, 6, 12, and 24 h post-feed. Beads appear white and can be seen throughout the DT and collecting near the anus post-expulsion. c Images of a representative shank3abΔC +/− larva at 3, 6, 12, and 24 h post-feed. d Graph of bead distribution per time point for WT fish. Each point represents the average +/− standard error of the percentage of total beads held by each region (PH, IB, UI, LI, or EXP) over time (n = 13). e Graph of shank3abΔC +/− mutant average +/− standard error bead distribution over time (n = 15)