
Fig. 7
- ID
- ZDB-FIG-190618-39
- Publication
- Hanovice et al., 2019 - Regeneration of the zebrafish retinal pigment epithelium after widespread genetic ablation
- Other Figures
- All Figure Page
- Back to All Figure Page
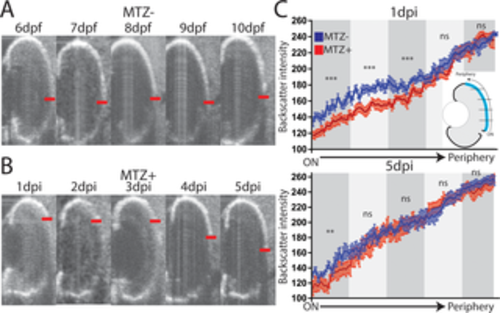
Longitudinal OCT analysis of RPE regeneration. (A-C) Representative time series from a single (A) unablated and (B) ablated larva. Central edge of maximal RPE intensity marked with red line. (C) Quantification of the RPE signal (backscatter) from the dorsal periphery to optic nerve across unablated (blue) and ablated (red) larvae at 1dpi and 5dpi (error bars = SEM). The measured RPE was divided into quintiles (cartoon), and the area under the curve within each quintile was measured. At 1dpi, backscatter intensity in ablated RPE is significantly below unablated intensity in the 3 quintiles closest to the optic nerve, while at 5dpi, only the central-most quintile is significantly reduced (MTZ-: n = 10, MTZ+ n = 9, Student’s unpaired t test, **p<0.005, ***p<0.0005). |