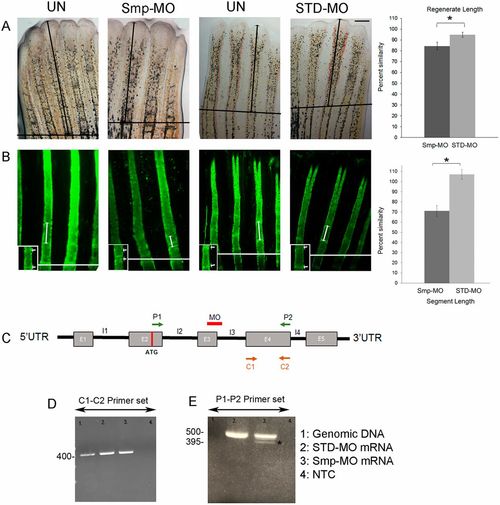
The Smp-KD phenotypes include significantly reduced segment length and regenerate length. (A) Regenerate length is reduced in Smp-MO-treated fins compared with STD-MO-treated fins. All fins were amputated at the 50% level. The amputation plane is indicated (black line). The black arrow indicates the distance from the amputation plane to the distal tip of the 3rd fin ray. Graph shows significant reduction in percentage similarity in Smp-MO- and STD-MO-injected fins (*P<0.05, Student's t-test, two-tailed and unpaired). Three independent trials were performed (n=25 total per treatment). The data did not differ significantly from normality (Shapiro-Wilk's test, P>0.05). Error bars represent s.e.m. (B) Calcein-stained fin rays show reduced segment length in Smp-MO-treated fins compared with STD-MO-treated fins. Double-headed arrows indicate the first completed segment following the amputation plane (white line). The inset shows a higher magnification of the segments (arrows indicate joints). Graph reveals significant reduction in percentage similarity in Smp-MO- and STD-MO-injected fins (*P<0.05, Student's t-test, two-tailed and unpaired). Three independent trials were performed (n=25 total per treatment). The data did not differ significantly from normality (Shapiro-Wilk's test, P>0.05). Error bars represent s.e.m. (C) Schematic representation of zebrafish smp pre-mRNA. The exons are shown in gray boxes and the introns are drawn as black lines. Positions of the MO and of the primers are indicated. The MO is predicted to cause skipping of exon 3 (55 bp). (D) Results of the RT-PCR analysis using C1-C2 primer set (396 bp product is predicted). (E) Results of the RT-PCR analysis using P1-P2 primer set reveals reduced full-length product and Smp-MO-dependent presence of the shorter product. The P1-P2 primer pair amplified product (380 bp) in lane 3 marked with an asterisk is caused by the skipping of exon 3 compared with lane 2, where exon 3 was included (435 bp). Scale bar: 50 μm.
|
