
FIGURE
Fig. 3
- ID
- ZDB-FIG-190328-18
- Publication
- Park et al., 2018 - Zebrafish model of KRAS-initiated pancreatic cancer
- Other Figures
- All Figure Page
- Back to All Figure Page
Fig. 3
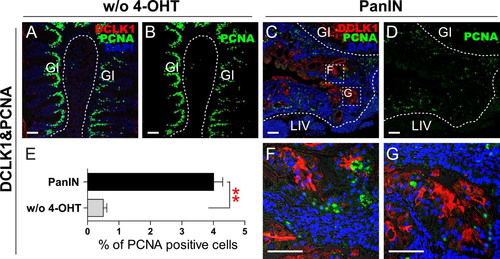
DCLK1 and PCNA staining in PanIN regions. (A and B) DCLK1 and PCNA staining in groups without 4-OHT treatment (w/o 4-OHT) as controls. Scale bars: 50 μm. (C and D) DCLK1 and PCNA staining in PanIN regions. Boxed areas indicate regions depicted at higher magnification in adjacent images. Scale bars: 50 μm. (E) Quantification of PCNA positive cells in groups without 4-OHT treatment, and in PanIN regions. (**P < .01, one-way ANOVA). (F and G) Magnified region of boxed areas in Figure 3(C). Scale bars: 50 μm. |
Expression Data
| Antibodies: | |
|---|---|
| Fish: | |
| Condition: | |
| Anatomical Terms: | |
| Stage: | Adult |
Expression Detail
Antibody Labeling
Phenotype Data
| Fish: | |
|---|---|
| Condition: | |
| Observed In: | |
| Stage: | Adult |
Phenotype Detail
Acknowledgments
This image is the copyrighted work of the attributed author or publisher, and
ZFIN has permission only to display this image to its users.
Additional permissions should be obtained from the applicable author or publisher of the image.
Full text @ Animal Cells Syst (Seoul)