
Fig. S8
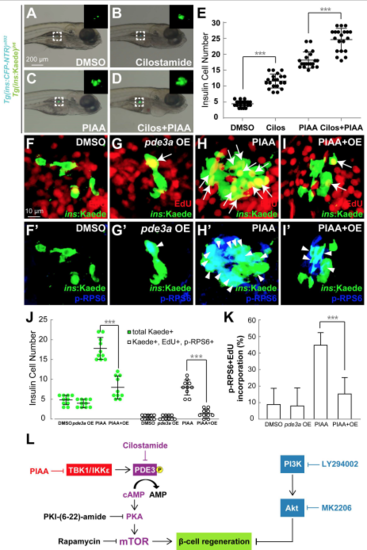
Suppression of TBK1/IKKε bestows an mTOR-mediated increase in b-cell number via PDE3. (A-D) Bright-field images combined with fluorescent images showing the overall morphology and [Tg(ins:CFP-NTR)s892; Tg(ins:Kaede)jh6] expression (green) of larvae at 48 hpa treated with DMSO (A), cilostamide (B), PIAA (C), and PIAA with cilostamide (D), respectively. The combination of cilostamide with PIAA resulted in increase in the [Tg(ins:CFPNTR) s892; Tg(ins:Kaede)jh6]-expressing cell population during regeneration (D) compared to individual treatment (B and C). The insets display magnified views of the pancreatic islets (outlined by the dashed squares). (E) Quantification of the number (mean±SD) of total regenerated b-cells at 48 hpa (in A-D; 4.5±1.0 (DMSO), 11.6±2.2 (cilostamide), 18.2±2.6 (PIAA), and 24.6±3.6 (cilostamide with PIAA). Cells in 20 planes of confocal images from 20 individual larvae were counted per condition. ***, P < 0.001. (F-I’) Confocal images of EdUadministered [Tg(ins:CFP-NTR)s892; Tg(ins:Kaede)jh6] larvae at 48 hpa, treated with DMSO (F and F’) and PIAA (H and H’), respectively, or induced pde3a expression upon b-cell ablation (G and G’) and pde3a expression upon b-cell ablation in the presence of PIAA (I and I’), respectively, from 0-48 hpa, stained for pRPS6 (blue). The number of EdU-incorporated (white arrows) and pRPS6-positive (white arrowheads) b-cells was increased in recovering larvae treated with PIAA (H and H’) compared to DMSO-treated larvae (F and F’). When pde3a expression was induced upon b-cell ablation, PIAA-dependent increases in the number of EdUincorporated and pRPS6-positive b-cells were suppressed (I and I’). (J) Quantification of the number (mean±SD) of total regenerated b-cells (green dots) and regenerated b-cells that incorporated EdU with pRPS6 immunoreactivity (white dots) at 48 hpa (in F-I’; 4.8±1.2 total regenerated b-cells, of which 0.5±0.5 (DMSO), 4.0±1.0, of which 0.4±0.5 (pde3a overexpressing), 17.8±2.8, of which 8.0±1.9 (PIAA), and 8.0±2.8, of which 1.4±1.1 (pde3a overexpressing in the presence of PIAA) incorporated EdU with pRPS6 immunoreactivity). (K) The percentage (mean±SD) of regenerated b-cells that incorporated EdU with pRPS6 immunoreactivity at 48 hpa (in F-I’; 8.9±9.8% (DMSO), 8.0±11.0% (pde3a overexpressing), 44.8±7.6% (PIAA), and 15.3±9.9% (pde3a overexpressing in the presence of PIAA)). Cells in 20 planes of confocal images from 10 individual larvae were counted per condition. ***, P < 0.001. (L) A model depicting the cAMP-PKA-mTOR signaling cascade via PDE3 that mediates b-cell regeneration in response to TBK1/IKKε inhibition. The site of action of PIAA is shown in red, while those of LY294002 and MK2206 in blue, and cilostamide in purple. |