
Fig. 2
- ID
- ZDB-FIG-181002-25
- Publication
- Unal Eroglu et al., 2018 - Multiplexed CRISPR/Cas9 Targeting of Genes Implicated in Retinal Regeneration and Degeneration
- Other Figures
- All Figure Page
- Back to All Figure Page
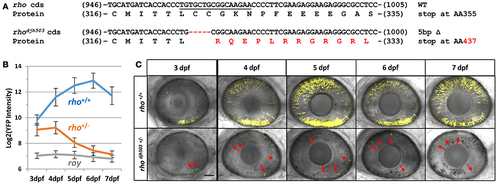
Genotype and phenotype of the CRISPR/Cas9-induced rhodjh503 mutation. (A) Sequence of the wildtype rho coding sequence targeted by CRISPR/cas9 (sgRNA sequence underlined) and the location of the 5 bp deletion in the rhodjh503 mutant allele. The amino acid sequences predicted to result from these open reading frames are shown below the nucleotide sequence with the altered sequence highlighted in red. (B) YFP signal intensity changes in rho+/+ fish and rhodjh503+/− mutant fish from 3 to 7 dpf (±sd). Daily fluorescence microplate readings of rho+/+ fish and rhodjh503+/− mutants in the rho:YFP-NTR background. The roy control group have no YFP-expressing transgene. Pairwise comparisons (i.e., T-test followed by Bonferroni correction for multiple comparisons) between per day data points produced p-values of ≤ 0.0005. (C) Composite maximum intensity projection images of confocal Z-stacks taken of the eyes of wildtype and mutant fish from 3 to 7 dpf. 3, 4, and 5 dpf images were taken with a 2x zoom while the 6–7 dpf images were taken with a 1.8x zoom. Several of the photoreceptors present in the mutant retinas are indicated by red arrows. The scale bar represents 50 μm in the 3–5 dpf images and 55.6 μm in the 6 and 7 dpf images. AA, amino acid; bp, base pair; cds, coding sequence; dpf, days post-fertilization; WT, wildtype; YFP, yellow fluorescent protein. |
| Fish: | |
|---|---|
| Observed In: | |
| Stage Range: | Protruding-mouth to Days 7-13 |