
Fig. 1
- ID
- ZDB-FIG-180913-21
- Publication
- Marsh et al., 2017 - Asymmetry of an Intracellular Scaffold at Vertebrate Electrical Synapses
- Other Figures
- All Figure Page
- Back to All Figure Page
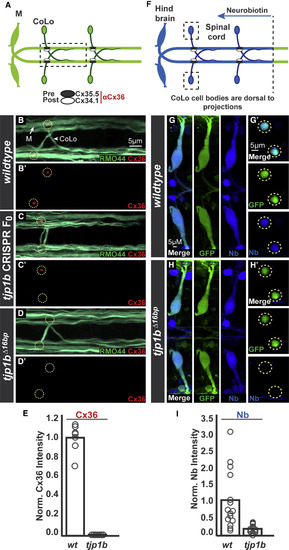
The MAGUK Scaffold Tjp1b Is Required for Electrical Synapse Formation and Function (A) Schematic of the Mauthner circuit in dorsal view with anterior to the left (here and in all figures). Neurons and synapses of the hindbrain, with two of 30 spinal segments, are shown. Mauthner neurons send axons into the spinal cord making electrical synapses (black and white ovals) with commissural locals (CoLos). The M/CoLo synapses require two connexins (Cxs) for formation, presynaptic Cx35.5 (black ovals) and postsynaptic Cx34.1 (white ovals). The boxed line denotes the region of spinal cord shown in (B)–(D). (B–D) Dorsal views of a spinal cord segment from 5-day-post-fertilization zebrafish larvae. Images are maximum-intensity projections of ∼5 μm (here and in all figures, unless otherwise noted) stained for neurofilaments (RMO44, green) and an anti-human-Connexin36 (Cx36, red) that labels both Cx35.5 and Cx34.1 proteins [12]. Neighboring panels show individual Cx36 channels. (B and B′) Wild-type. Mauthner and CoLo neuronal processes, along with other spinal cord neuronal projections, are stained with RMO44. The sites of M/CoLo synaptic contact are noted with dashed yellow circles. (C and C′) Mosaicly mutant CRISPR-injected F0 animals targeting the tjp1b locus. (D and D′) Homozygous tjp1b mutant. (E) Quantification of Cx36 fluorescent intensities in wild-type and tjp1b mutants. Wild-type and mutant are significantly different (p < 0.0001). In this and all other quantifications, an unpaired t test with Welch’s correction was used, unless otherwise noted. (F) Schematic of retrograde labeling of Mauthner axons with the gap junction permeable dye Neurobiotin (Nb) applied from a caudal transection (dotted line). The boxed region denotes the CoLo cell bodies shown in (G′) and (H′). (G and H) Hindbrain (∼15 μm projection; G and H) and spinal cord (G′ and H′) images from M/CoLo:GFP transgenic animals at the level of the cell bodies stained for anti-GFP (green) and Nb (blue). Note that other neurons found near Mauthner in the hindbrain are also filled by the retrograde labeling procedure (Nb signal in non-GFP-expressing cell bodies in G and H). (G and G′) Wild-type M/CoLo:GFP. (H and H′) Homozygous tjp1b mutant in M/CoLo:GFP transgenic background. (I) Quantification of the ratio of Nb in CoLo to Mauthner cell bodies in wild-type and mutant animals. Wild-type and mutant are significantly different (p = 0.002). In (E) and (I), the height of the bar represents the mean of the sampled data with each circle representing the average of 10–16 M/CoLo synapses within an animal. See associated data and statistics in Data S1 and related data in Figure S1. |
| Gene: | |
|---|---|
| Antibodies: | |
| Fish: | |
| Anatomical Terms: | |
| Stage: | Day 5 |
| Fish: | |
|---|---|
| Observed In: | |
| Stage: | Day 5 |