
Fig. 3
- ID
- ZDB-FIG-180827-26
- Publication
- Wu et al., 2018 - A Rapid Method for Directed Gene Knockout for Screening in G0 Zebrafish
- Other Figures
- All Figure Page
- Back to All Figure Page
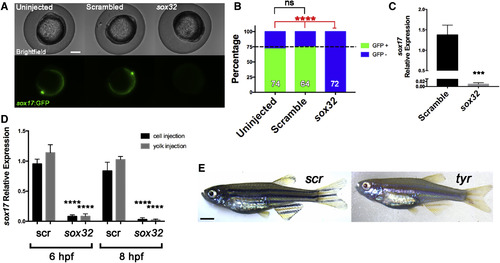
Onset and Durability of Phenotypes in G0 Embryos and Adults Embryos were cell-injected at the one-cell stage with four-guide Cas9 RNP targeting casanova (sox32) (A–D) or tyr (E) or with scrambled guides as indicated. (A–D) Impaired endoderm marker expression in G0 embryos after four-guide targeting of sox32. (A and B) Fish hemizygous for the endoderm marker Tg(sox17:GFP) were intercrossed and the resulting embryos injected with the indicated four-guide Cas9 RNP and imaged at 10 hpf. (A) Representative images. Scale bar, 250 μm. (B) Percentage of embryos expressing GFP (green) or not (blue). Dotted line indicates 75%, the percentage of fluorescent embryos expected from the hemizygous transgenic cross. ∗∗∗∗p < 0.0001; ns, not significant; Fisher's exact test for presence or absence of GFP fluorescence. The number of embryos analyzed is shown in each column. (C) Embryos injected with sox32 four-guide Cas9 RNP were collected at 10 hpf and sox17 expression was measured by qPCR. Expression of sox17 mRNA in scrambled control-targeted and sox32-targeted embryos relative to uninjected controls is shown. Graph represents mean ± SEM (n = 4). ∗∗∗p < 0.001, unpaired two-tailed t test. (D) sox17 expression in embryos cell-injected (black) or yolk-injected (gray) with scrambled (scr) or sox32 four-guide Cas9 RNP at the 1-cell stage and collected at 6 or 8 hpf. Expression is normalized to that in uninjected embryos. ∗∗∗∗p < 0.0001; ns, not significant by one-way ANOVA with Sidak's multiple comparisons test compared with equivalent scr experiment in injection method and collection time. (E) Phenotype durability. Embryos were injected with a four-guide Cas9 RNP mix targeting tyr and raised to adulthood. A representative 2-month-old G0 tyr-targeted zebrafish is on the right; control is on the left. Scale bar, 2 mm. Note lack of dark stripes characteristic of tyr knockouts. |
| Genes: | |
|---|---|
| Fish: | |
| Knockdown Reagents: | |
| Anatomical Term: | |
| Stage Range: | Shield to Bud |
| Fish: | |
|---|---|
| Knockdown Reagents: | |
| Observed In: | |
| Stage Range: | Shield to Bud |
Reprinted from Developmental Cell, 46, Wu, R.S., Lam, I.I., Clay, H., Duong, D.N., Deo, R.C., Coughlin, S.R., A Rapid Method for Directed Gene Knockout for Screening in G0 Zebrafish, 112-125.e4, Copyright (2018) with permission from Elsevier. Full text @ Dev. Cell